Chart of the Day: This Portfolio Holding Looks Ready to Light Up
The stock has made a nice move higher on good volume over the last couple months.
You've reached your free article limit
You've read 0 of 1 free Pro articles.
The early August "mini crash" on Aug. 5 was no laughing matter.
The chart of the S&P 500 and Nasdaq sustained damage, but thankfully time allowed those days' losses to be wiped away. Such is the case for Universal Display OLED, one of the better performing names in TheStreet Pro Portfolio since that fatal trading day.
The stock made a nice low on Aug. 5 and continues to rally forward, making higher-highs and higher-lows along the way. That is the textbook definition of an uptrend. The price chart shows blue candles, a strong buy situation based on the GoNoGo composite of indicators at the top of the chart.
The supporting indicators below the price chart are coming around here, the stock seems to be at a resting spot in a higher price zone. Hence, we often see a stock move in the direction of the previous trend. In this case, up is the direction.
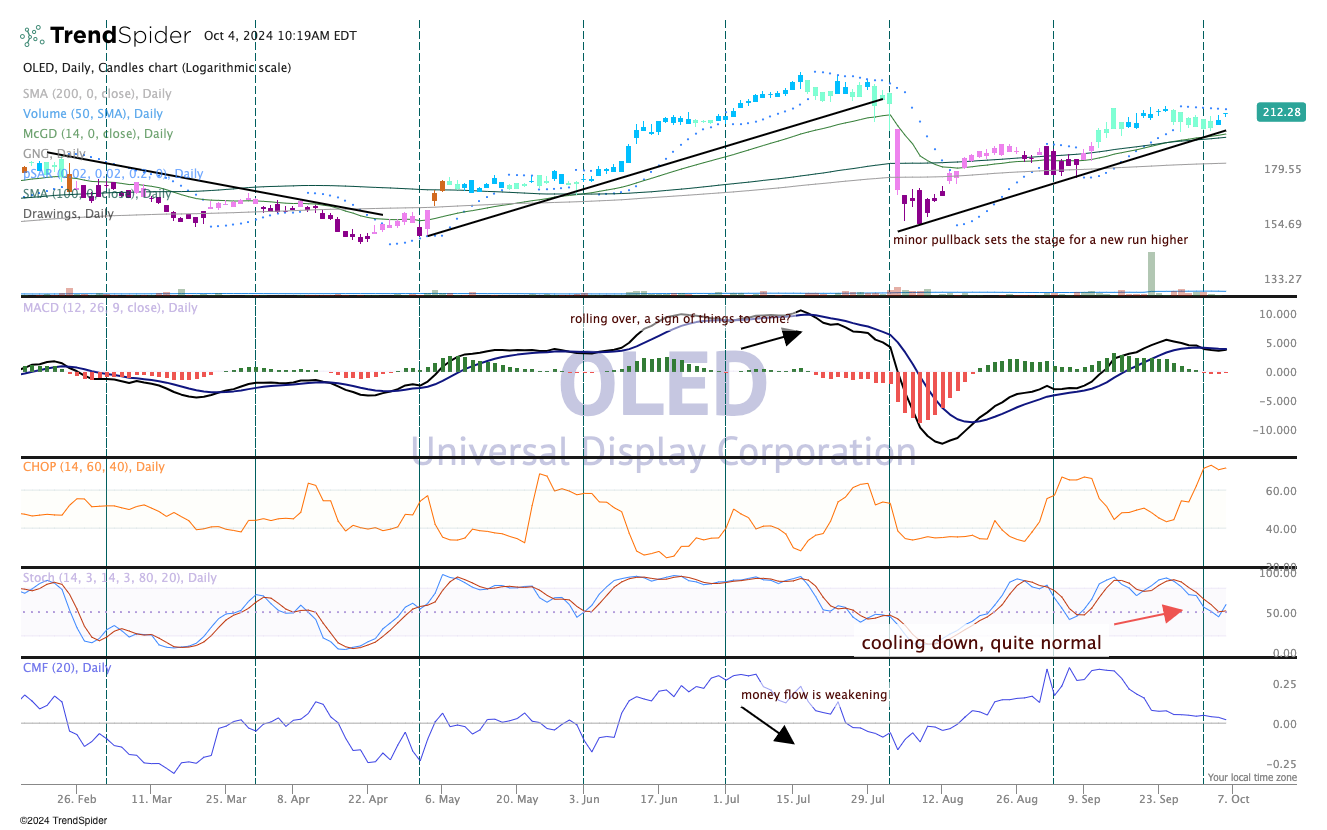
Looking at the bottom pane of the chart, money flow has cooled down a bit as has momentum, which is not a surprise after big run from the August lows.
We rate OLED a one in Pro Portfolio, a buy at anytime. Note, we have a price target of $250, but a move to fill the gap at $218 should make this stock very interesting on the buy side, and that $250 target might be achieved sooner rather than later.
At the time of publication, TheStreet Pro Portfolio was long OLED.
