Charting the Markets: A Good Old-Fashioned Rally. Now What?
It took some effort for the S&P 500 to get here in a month, but maybe there are legs to this latest move.
You've reached your free article limit
You've read 0 of 1 free Pro articles.
A new month tends to breathe life into markets. That is certainly true for the first two trading days of May, with the S&P 500 up nearly 0.7% so far. But the bulls should not celebrate for too long as we have now reached a nine-day winning streak, the longest in several years, and a massively overbought condition that is just begging to be sold.
We're not market timers here but certainly one can understand the twisted logic of this recent buying frenzy. Good earnings, positive economic data (jobs report) and hope for trade issue resolution has put investors/traders into a state of FOMO (fear of missing out). However, it likely won't end well for those coming late to the party.
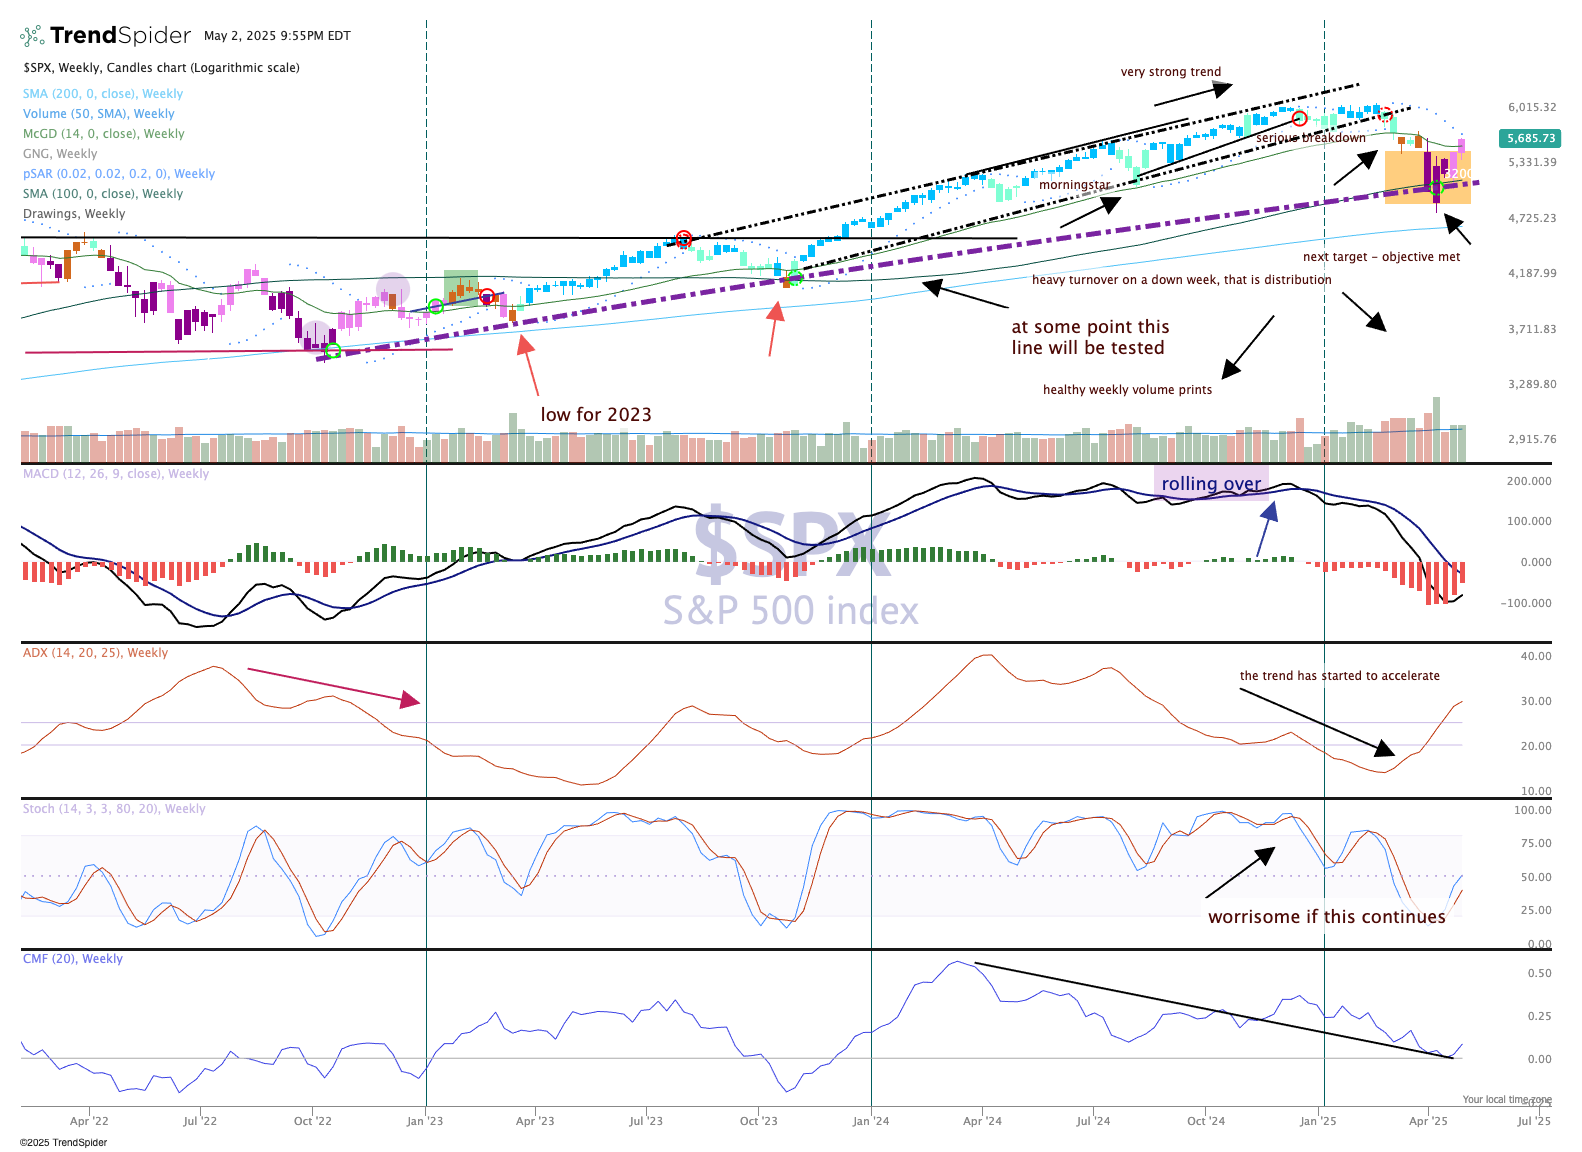
The chart shows more improvement this past week with higher highs and higher lows on the latest candle, BUT it is still pink, which reflects a cautiously bearish condition. Money flow (bottom pane) has improved and so has MACD (moving average convergence/divergence), which may turn to a strong buy signal in a couple of weeks. The ADX shows powerful strength, and if this is a new bull trend there is much further to go, according to this indicator.
Pay attention this week, volatility came crashing down but we have a Fed meeting and several key earnings on tap.
