Charting the Market: The S&P 500 Marches Forward
Amid volatility, higher highs and higher lows, the uptrend remains intact.
You've reached your free article limit
You've read 0 of 1 free Pro articles.
With all that could go wrong this past week there came a glimmer of hope. Inflation data was delivered on Wednesday and Thursday and showed evidence that price stability was starting to come into view. That is one of two mandates for the Federal Reserve (FOMC), the other being the goal of full employment.
The stock market has been running strong this year on the hopes the FOMC will consider reducing the overnight funds rate. It has been nearly a year since the last rate hike (late July 2023) and since then inflation has certainly been on the decline. The worry from the Fed of course, is they might blink too early and re-ignite inflation with a less-restrictive policy.
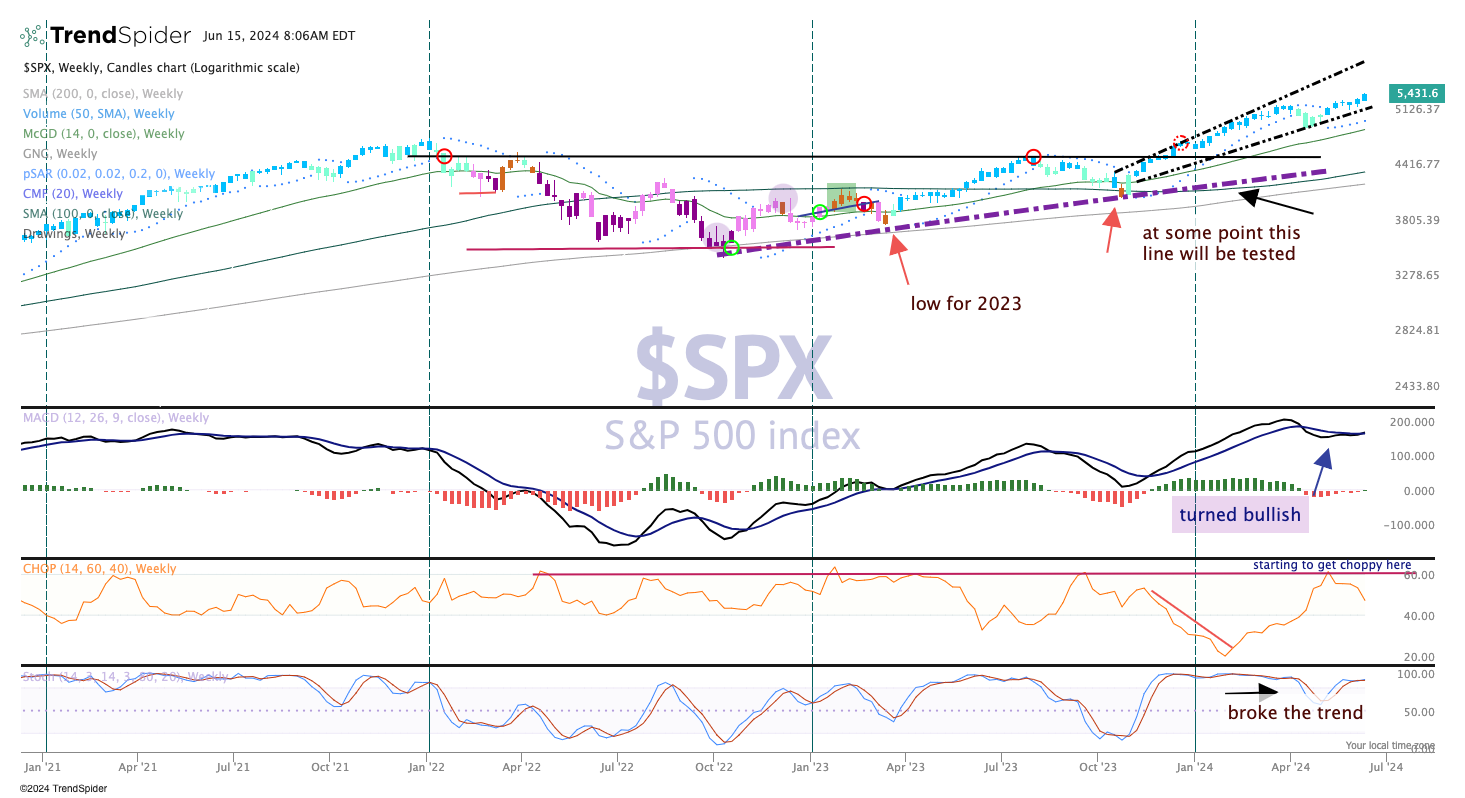
The S&P 500 took that new data in stride and even with a policy meeting midweek, the index did not seem flustered. It was a strong week, but as we see in the above chart, the shape of the rally indicates an objective that is much higher to the top of the range. That level is actually about 5850 on the index, or about 8% higher and rising each week.
The Moving Average Convergence Divergence (MACD) remains bullish but the choppiness indicator has turned lower (pane 3). What's that mean exactly? When this indicator is rising there is a chance for this index to start trending, and if the prior direction is up then that is the direction. That would be bullish for markets.
Stochastics remain bullish and momentum is strong. We'll just say here, "steady as she goes."
