Chart of the Day: Time to Add to Applied Materials? Yes, and We Did So
Testing lower levels recently was successful.
You've reached your free article limit
You've read 0 of 1 free Pro articles.
We felt some pain in holding shares of Applied Materials AMAT recently after some competitors failed to meet earnings expectations. That is not unusual in the chip equipment space, but as we have seen over the past few quarters Applied has not been hit nearly as bad as the competition. In fact, the company has delivered strong earnings for a while now, but continues to track with others such as KLA Corp. KLAC, Lam Research LRCX and ASML Holding ASML .
As it stands now, Applied is performing the best on a technical basis and should be considered for adding more shares. Indeed, we did just that last week. We rate AMAT a Two in TheStreet Pro Portfolio, or "stockpile on pullbacks."
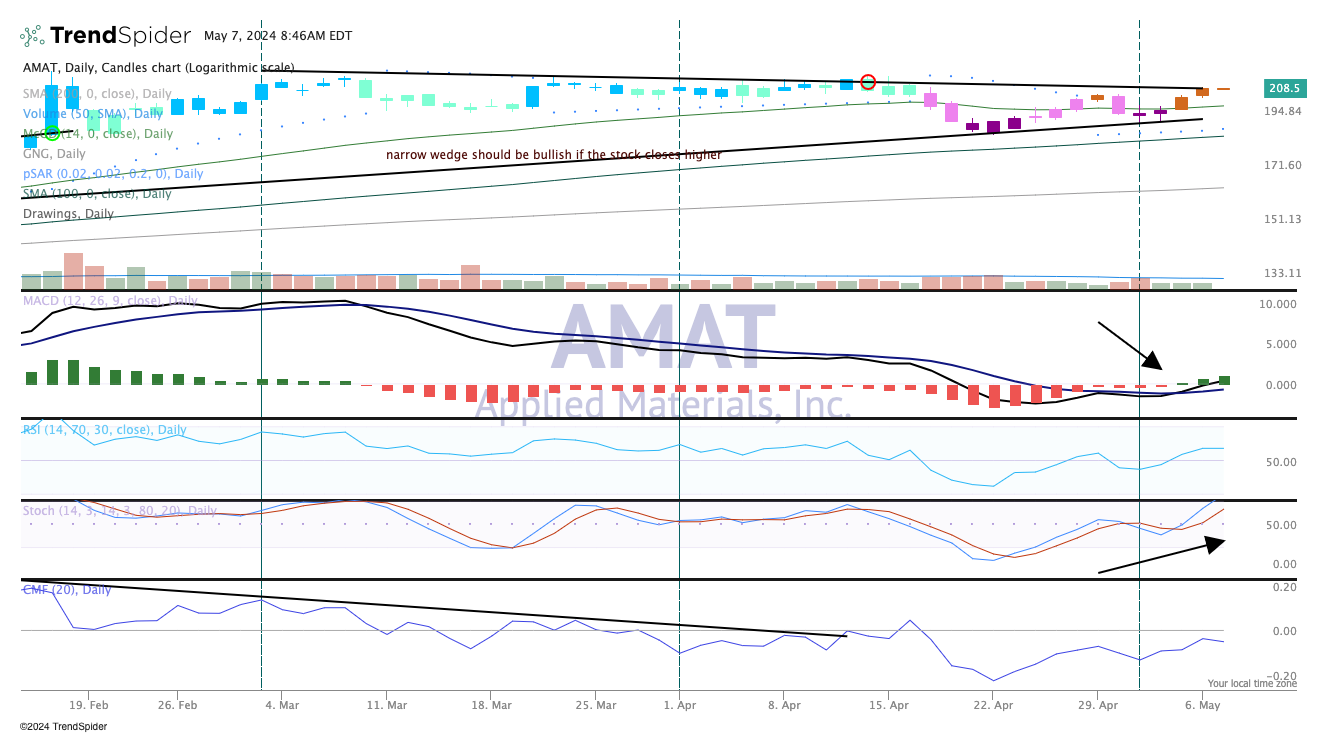
Turning to the AMAT chart, the GoNoGo in the top pane, the colored candles which tell us where a stock is positioned, shows a trip from bullish to bearish to neutral. That would be your classic corrective period, and with the recent test below $190 we see a higher low and higher highs created, our textbook definition of an uptrend. Yet there is a downtrend line putting pressure on the stock. A breakout above there would be bullish.
Stochastics, shown in the fourth pane, are looking better and making a run to overbought — that could be in place with a few more AMAT rally days.
Moving Average Convergence Divergence (MACD), shown in the second pane, is now on a buy signal crossover. This indicator tells us changes in trajectory before they happen.
At the time of publication, TheStreet Pro Portfolio was long AMAT.
