Chart of the Day: This Energy ETF Is Strong During Volatile Moments
A breakout move is certainly starting.
You've reached your free article limit
You've read 0 of 1 free Pro articles.
A prolonged pullback here in the the Energy Select Sector SPDR Fund XLE may have one worried about the current trend. Actually, in the short term there is no trend but longer timeframes — weekly and monthly charts — show this to be true.
A pullback from a higher base is not unusual and is often needed after a sharp rise. That is happening now, and wouldn't you know it — a pullback and flirtation with a key moving average.
We can see that in the top pane, the very reliable McGinley Dynamic 14 period moving average, a technical indicator that improves upon moving average lines by adjusting for market speed.
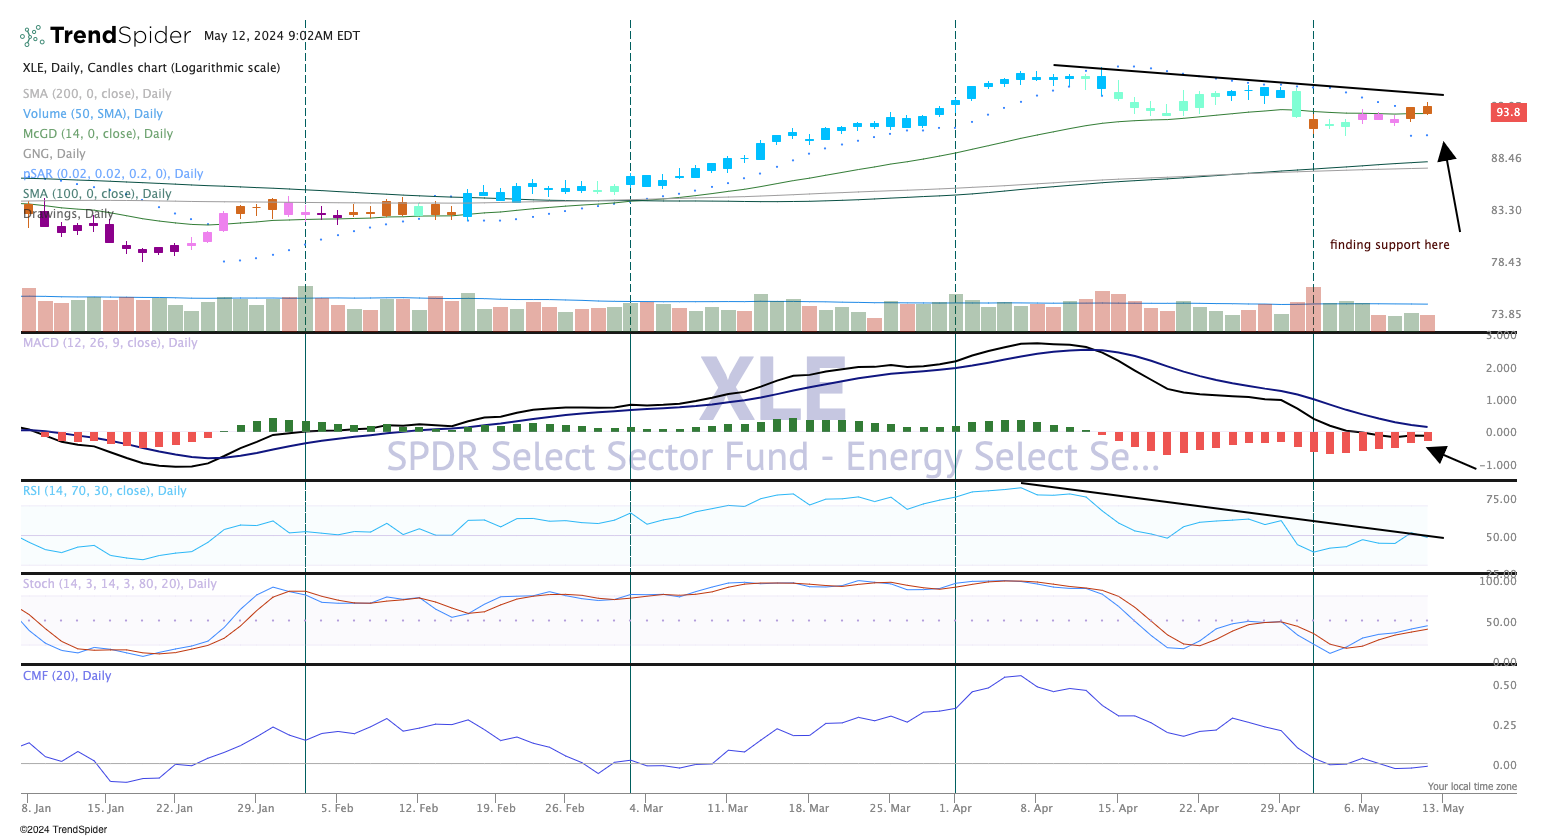
The recent pullback was on moderate volume, kicked up likely from the rise in oil volatility. Remember, elevated volatility does not mean stocks have to go down, it simply means the range is expanded, and risk averse players abhor big movements.
The XLE shows a budding rise happening, and with higher lows in place (top chart), the parabolic SAR (stop and reverse) is on buy signal, while stochastics (momentum, pane 4) is starting rise. Indeed more upside needs to occur before we can call this a breakout move, but it is certainly starting.
We rate the XLE as a two in TheStreet Pro portfolio, or stockpile on pullbacks.
More Pro Portfolio
At the time of publication, TheStreet Pro Portfolio was long XLE.
