Chart of the Day: ServiceNow Pulls Back For Another Buying Opportunity
The stock remains in a strong uptrend but pullbacks should be heeded as a chance to add.
You've reached your free article limit
You've read 0 of 1 free Pro articles.
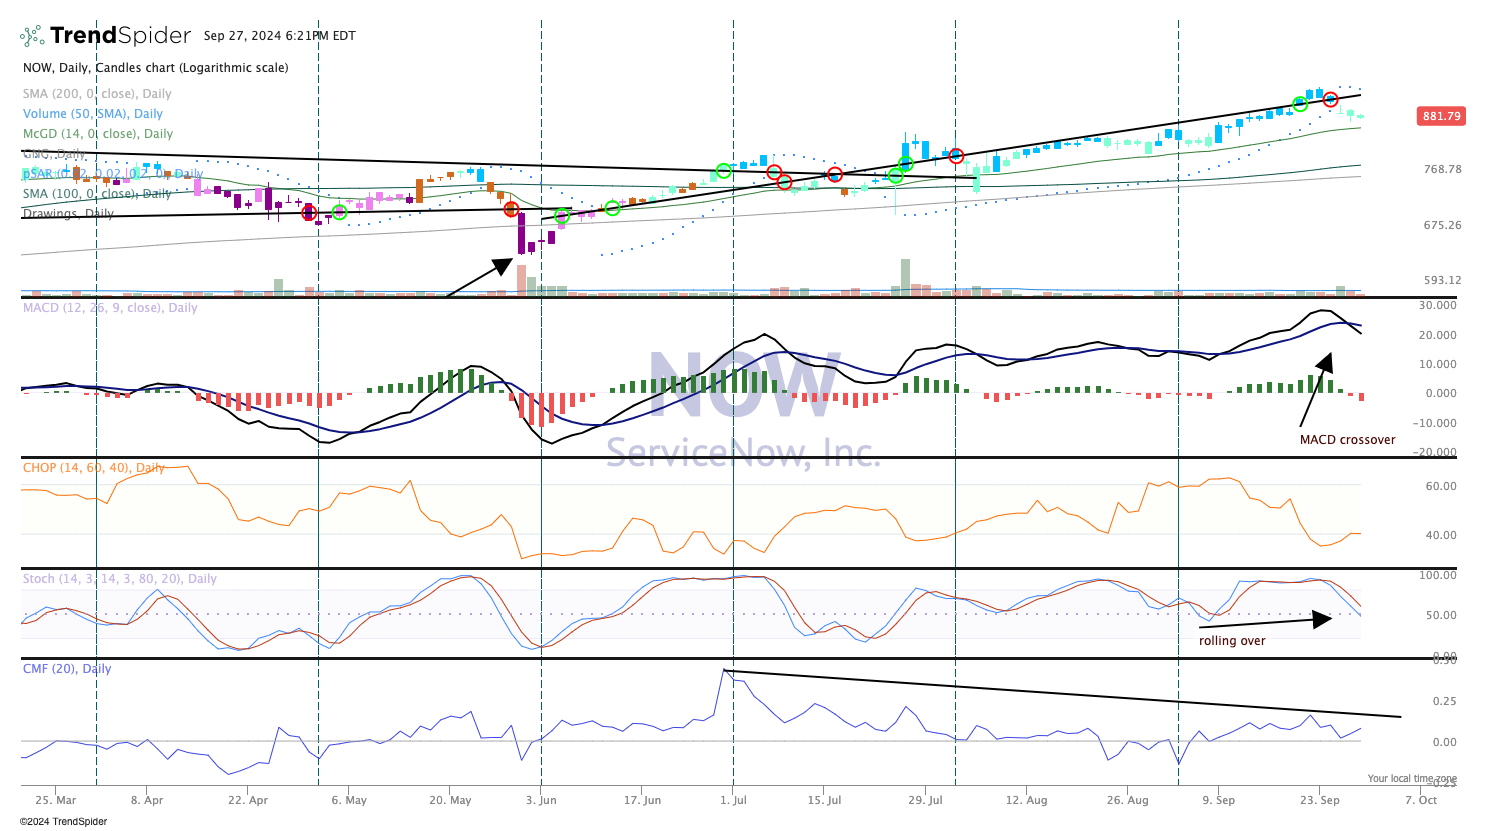
Since that frantic low in May of this year we have seen ServiceNow (NOW) really make a nice run higher. The stock is pushing right up to the all time highs just set last week. Even this modest setback was on lower turnover, which means the big money was not distributing (selling) the stock. That's a positive, though the indicators are not flashing any buy signals at this time.
To view this chart in a new window, click here.
The MACD (moving average convergence/divergence) has just confirmed a bearish signal, the parabolic SAR (stop and reverse) in the top pane is also bearish, which is a sign the trajectory of price has turned downward. Stochastics (momentum) has turned lower as well, but the price action is still holding in bullish.
With mixed signals here we would suggest taking a look at adding more shares. Remember, the price action, which is bullish is the dominant indicator and the trend is still bullish.
We like ServiceNow and rate it a two in thestreetPro portfolio, or stockpile on pullbacks (like, right now!).
