Chart of the Day: Elastic Expands as Money Flows In
It's not a stretch to say this holding could exceed the old highs.
You've reached your free article limit
You've read 0 of 1 free Pro articles.
Elastic ESTC put forth another stellar quarter that has the stock within range of all-time highs. That level was hit in November, near $121, the stock backed away as buyers were not interested at those higher levels. But here we are with yet another strong quarter and the technicals starting to turn positive.
Looking at the chart, below, we see that the Moving Average Convergence Divergence indicator, in the second pane, is about to cross over for a buy signal. Down in the second-to-bottom pane, meanwhile, we see Momentum (stochastics) is moving to the upside and is not quite overbought.
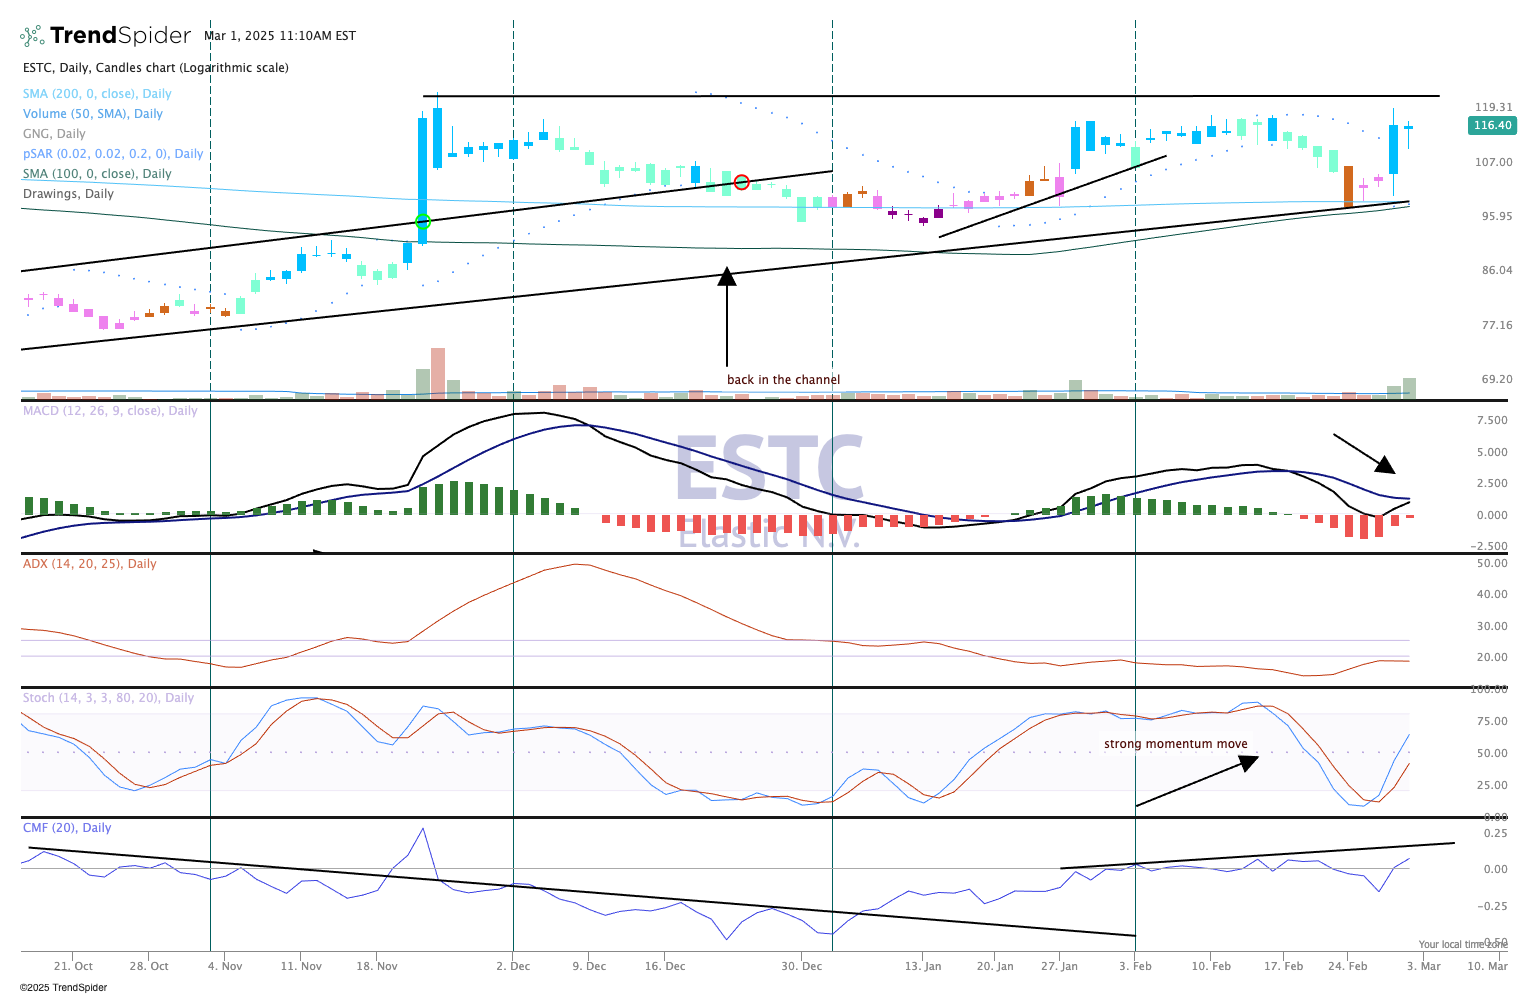
Money flow, at the bottom, is positive again. Also, check out the volume levels over the past couple of sessions, which show accumulation by big investors and funds. This is where we see more money flowing into Elastic, the recent highs at $119 being tested after earnings were released. Candles have been blue or teal for most of six weeks, the stock has performed better than the rest of the market (good relative strength, not shown).
Can the stock make a run higher? We believe so, first up is likely the $130 area after the old highs have been exceeded. We like Elastic and rate it a one in the Pro Portfolio, buy at anytime.
The Pro Portfolio is long Elastic.
