Chart of the Day: A Magnificent Seven Name Is Making a Bullish Move
The software giant is benefiting from AI and competitors' guidance.
You've reached your free article limit
You've read 0 of 1 free Pro articles.
This past week saw a very strong move from Microsoft MSFT, to levels not seen in a month. What we like seeing here in the chart below is the upward trajectory (top pane) with strong volume trends. The candles have just turned teal, which means cautiously bullish for the first time since July. The GoNoGo (colored candles) is a reliable guide that tells us the price direction at the time.
This past week Oracle ORCL delivered strong earnings and guidance and helped push Microsoft upwards.
Momentum is another key indicator that tells us the strength of the move and how long it may last. Stochastics (pane 4) is our preferred indicator and it is currently accelerating towards an overbought reading. Money flow (bottom pane) has been consistently positive for a month.
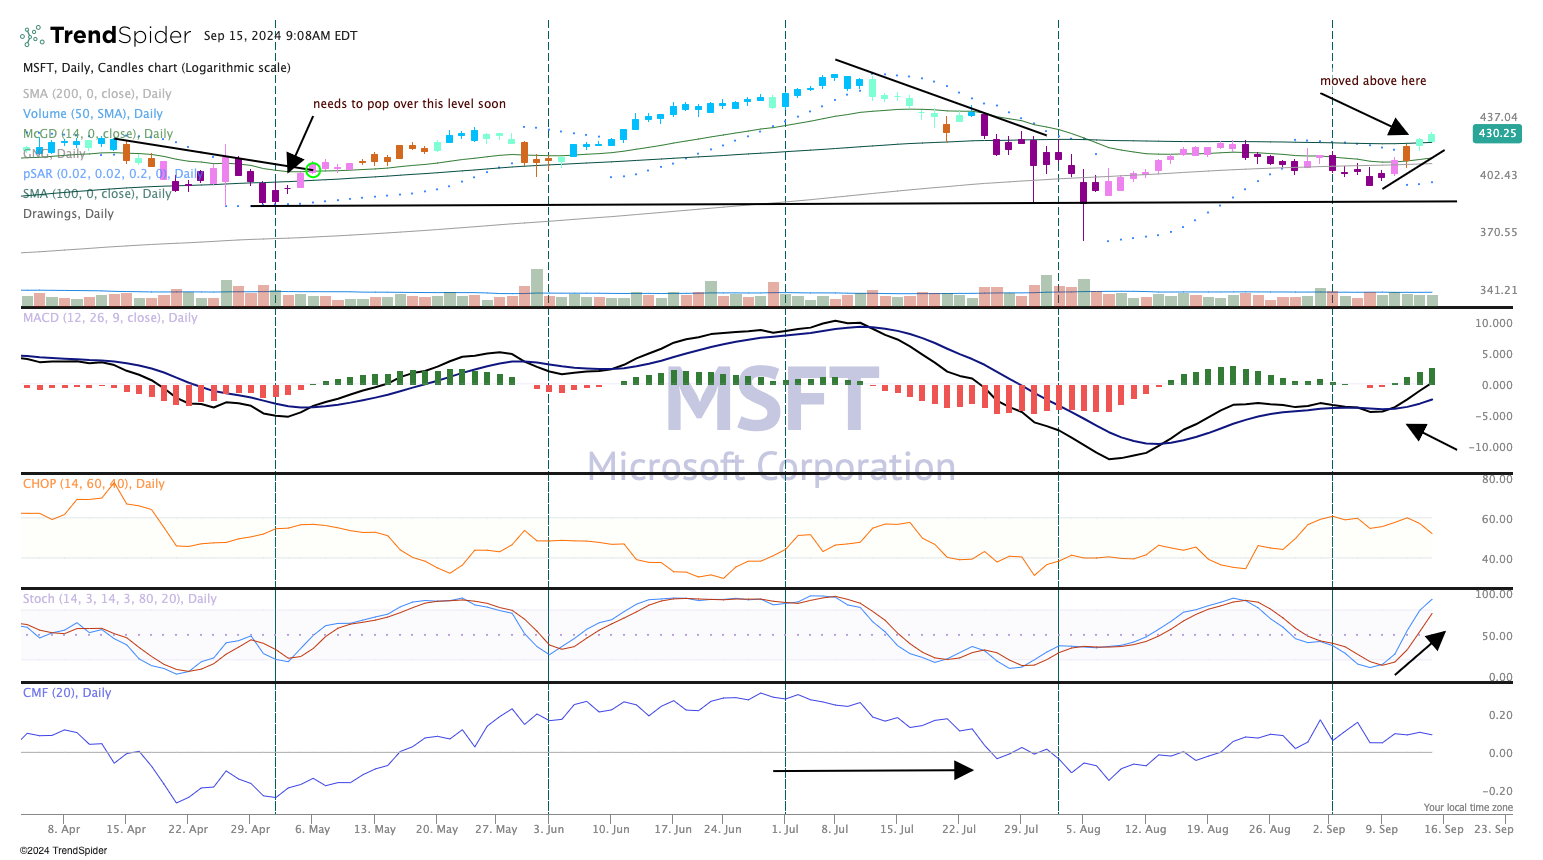
Microsoft has now broken above the last resistance moving average line, the 100-day moving average. This is an important development, as when the stock reaches an overbought condition (not currently) that 100-day moving average (call it $428) will likely be tested and provide another good entry point to buying the stock.
We rate Microsoft a Two in TheStreet Pro Portfolio, or "stockpile on pullbacks."
At the time of publication, TheStreet Pro Portfolio was long MSFT.
