Volume Analysis Gives Clues to Speculative Activity
Let's look at Nasdaq volume to see whether the market is frothy.
You've reached your free article limit
You've read 0 of 1 free Pro articles.
Over the past week or so, I have spent a great deal of time noting all the speculation that has developed in the market. Most of it, I believe, has centered on Bitcoin and all the trading around it, such as the stock MicroStrategy.
Around midweek last week, I started feeling as if I was beating a dead horse and I should stop, but that doesn’t mean the excessive speculation isn’t still there. I did notice that as soon as MSTR’s fever broke, it was as if the rest of the market was allowed to rally.
We can see it in the statistics, too. I have harped quite a bit about Nasdaq’s volume, noting that it was excessive, yet the NYSE’s volume had stayed pretty steady, averaging just over four billion shares daily.
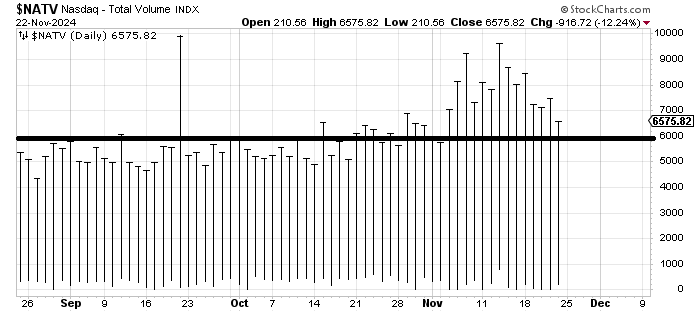
Nasdaq’s volume had become so wild, though. Here, we see how Nasdaq’s volume was very steady for the last few months, averaging about five billion shares daily. Then, right after the election, it soared, getting near ten-billion shares one day. That’s nearly double the average volume of the prior months!
Now, look at how the volume began to ease off on Tuesday last week. Friday was the lowest volume since the first trading day of November.
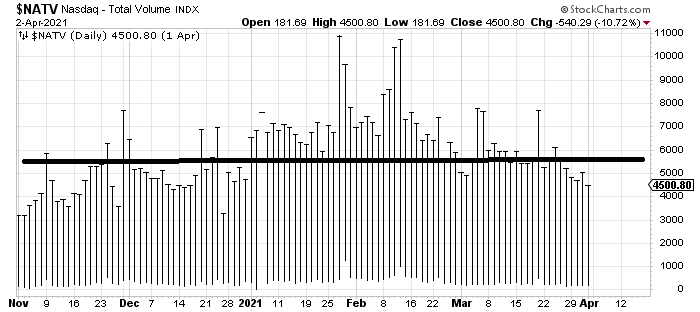
In this discussion of too much speculation, I have noted many times that we have not seen this since early 2021, so let’s look at that period as well. Here is Nasdaq’s volume heading into that speculative top. Do you see how it was mostly hovering just over five billion shares in the months before January? Then the calendar turned to 2021, and boom, seven billion became the norm.
In late January 2021 we more than doubled that average five billion shares to nearly eleven billion shares, not once but a few times as January turned to February. But notice there too, you can see the unwinding of the speculative fever as volume slowly returns to a more normalized level.
Now take a look at stocks making new highs from that time period and notice how extreme they got, with a reading of nearly 700 in early February. But here, too, slowly, the number of stocks making new highs starts to contract.
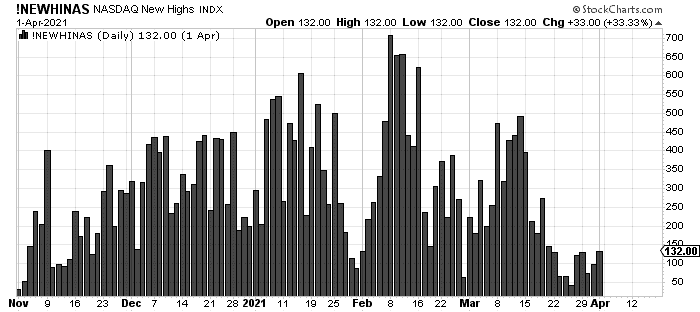
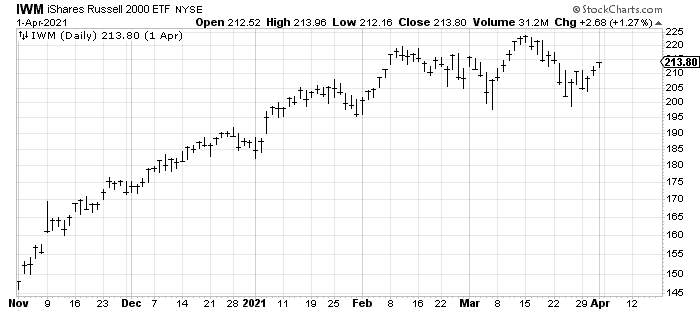
If we look at the chart of IWM from back then, we see that surge in early February followed by what seemed like a standard correction into early March and then the return to a higher high near 225. But look at that chart of stocks making new highs again and notice that they numbered almost 500, not the 700+ we had on the first trip up.
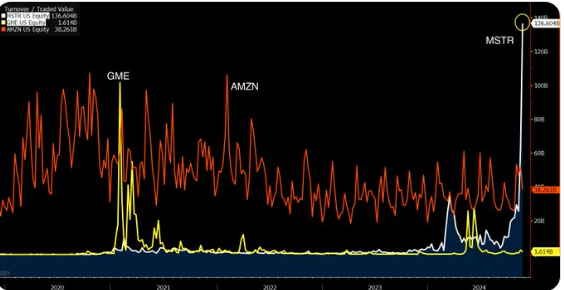
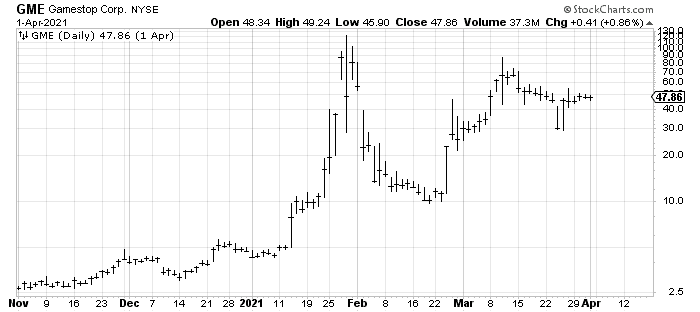
To close this out, let’s take a look at a chart, courtesy of Bloomberg, showing the inflows into Gamestop, Amazon and MSTR. That wild move in GME was in late January 2021. Compare it to MSTR last week.
I realize most folks think about March 2000 when they think about how a speculative frenzy ends, but that’s not the only time we’ve seen it. And they are much easier to see in hindsight than in real-time. Last week may have been it for now. I will only know in hindsight but the signs are there.