Time to Reverse Direction on the Japanese Stock Market?
The bull market in Japanese equities has traveled some 6,814 miles from Tokyo to Delaware.
You've reached your free article limit
You've read 0 of 1 free Pro articles.
Japanese stocks have soared — the highest levels since 1989 and the Nikkei 225 reaching the round number of 40K. Is this the time to jump in and go long or the time to take your gains and sit things out for a while?
Let's check out a few charts and indicators.
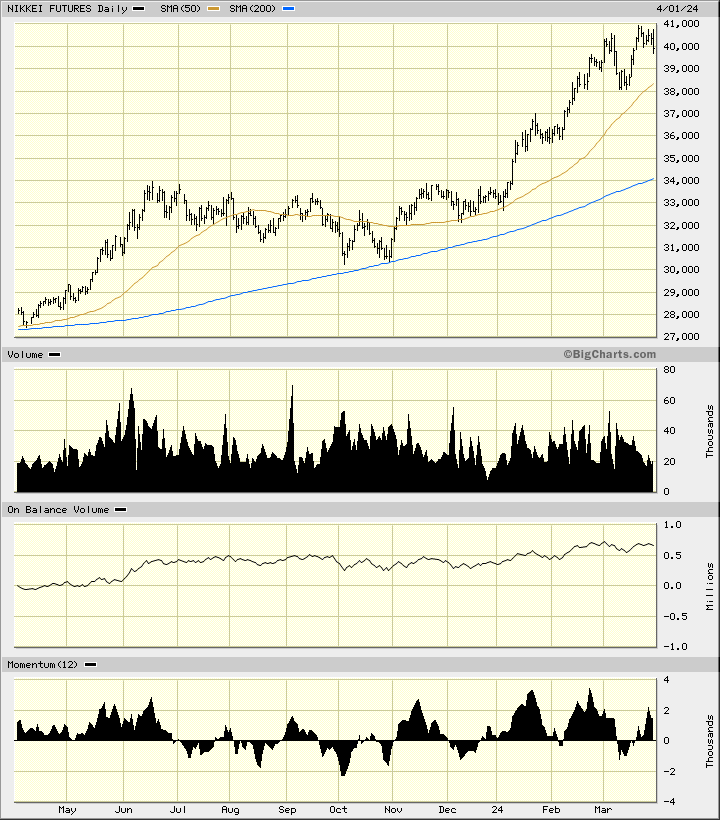
In the daily bar chart of the Nikkei futures, below, I can see a massive rally over the past 12 months. Prices are firmly above the rising 50-day moving average line and the rising 200-day moving average line. The On-Balance-Volume (OBV) line shows a gradual rise from May but it certainly does not match the price rise.
The 12-day momentum study shows lower highs from January to February to March. This is a bearish divergence as prices have made higher highs while momentum has made lower highs. This divergence could be foreshadowing a decline in price in the months ahead.
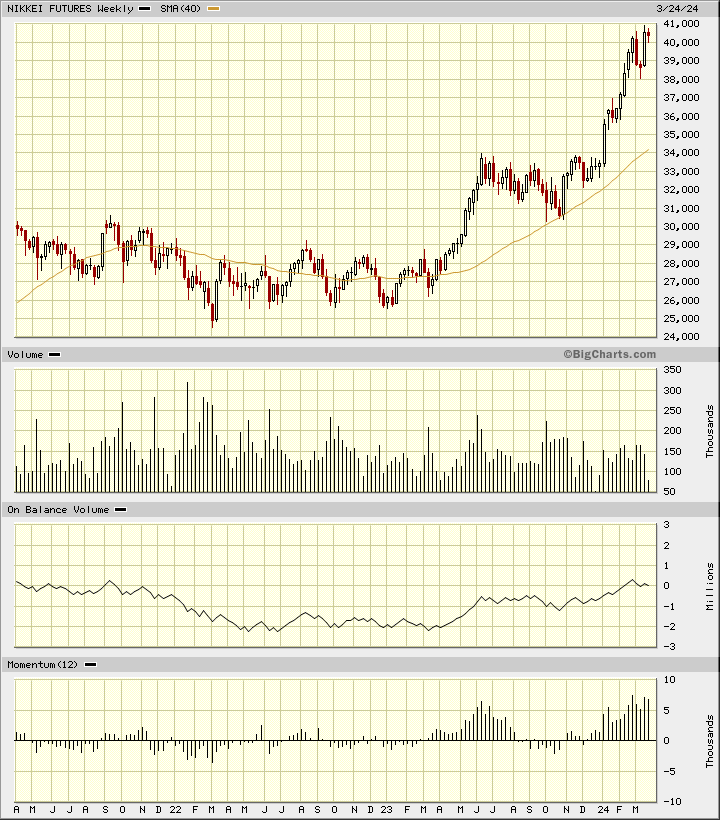
In the weekly Japanese candlestick chart of the Nikkei futures, below, I see a mixed setup. Prices made a base in 2022 and a rally in 2023 and early 2024. The Nikkei futures trade above the rising 40-week moving average line. The weekly OBV line has been positive the past year.
The 12-week price momentum study has begun to weaken even though prices have continued higher. This is a bearish divergence and a heads up that the trend could be changing. The most recent candle pattern is a spinning top or maybe a doji and these patterns could be part of a top reversal.
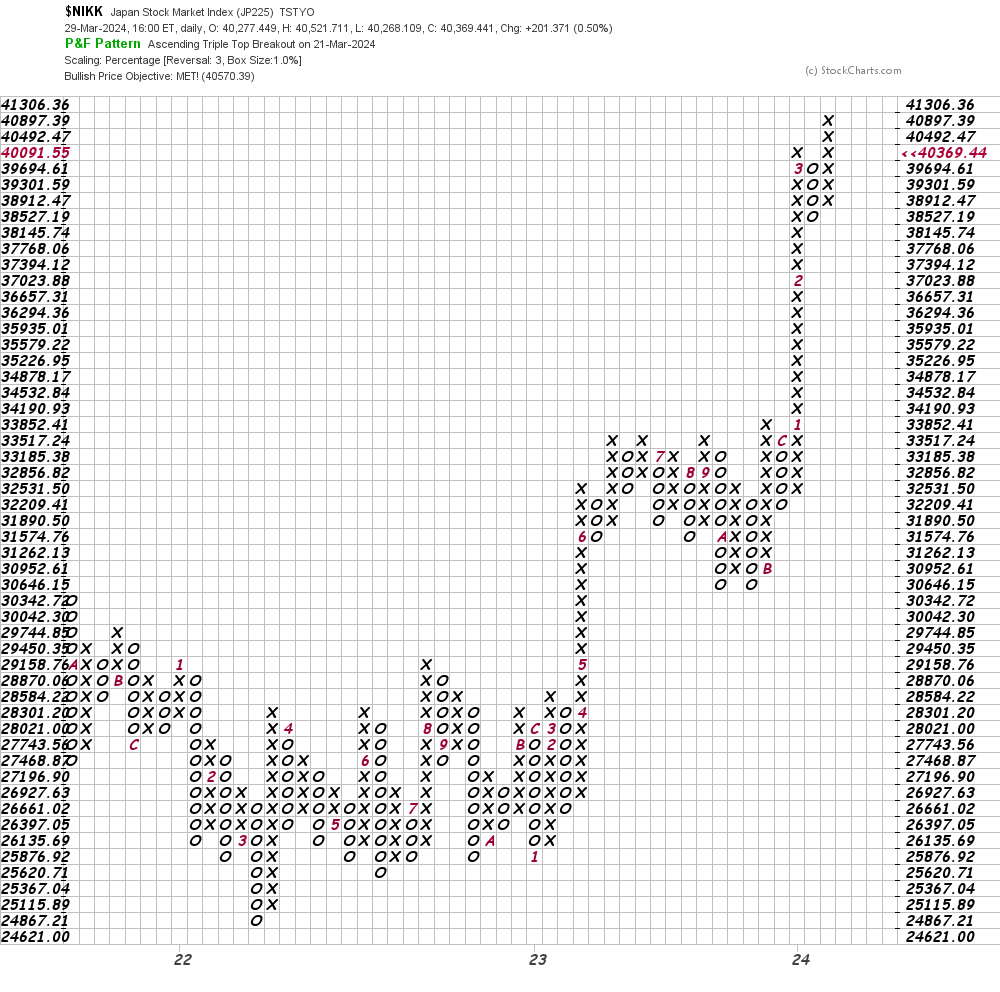
In this daily Point and Figure chart of the NSA 225, below, I can see that prices reached and exceeded a price target in the 40,570 area.
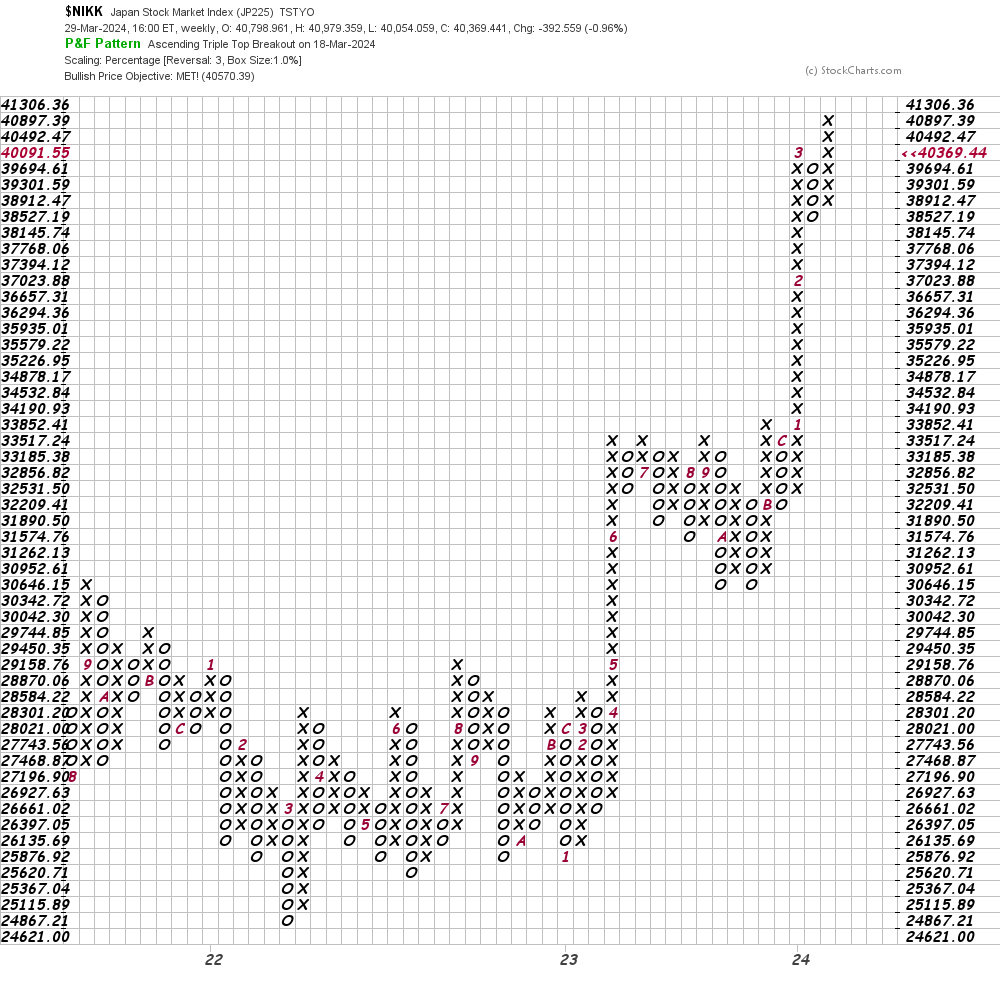
In this weekly Point and Figure chart of the NSA 225, below, I can see the same price target in the 40,570 area.
Bottom-line strategy: My wife and I were at a dinner party with two other couples last Friday night. The conversation covered the usual topics of where we moved from, what people did before retiring, children, grandchildren and then one person asked me about the Japanese stock market making record highs.
The bull market in Japanese equities has traveled some 6,814 miles from Tokyo to Delaware. Amazing and perhaps a sign that the rally is extended. Despite the records being set I would recommend taking profits on instruments like the iShares MSCI Japan ETF EWJ.
Employees of TheStreet are prohibited from trading individual securities.