The Market’s Biggest Problem Isn’t What You Think
It’s not earnings, interest rates, or oil prices. It’s the growing gap between where the indexes are trading and what individual stocks are actually doing.
You've reached your free article limit
You've read 0 of 1 free Pro articles.

As longtime readers know, I am not one to use fancy indicators. I don’t even have the computer skills to create them. But I do look at hundreds of charts, not just on a daily basis, but on a weekly basis.
I often can’t remember the price of a stock, but I can easily draw the shape of the chart for you from my head. I often joke it’s because I have no life, but I think it’s really my way of understanding the indicators I use, many of which are based on breadth.
By breadth, I mean not just the advance/decline line but also the number of stocks making new highs and new lows. Then there is the volume. How much volume is there on the upside vs. the downside? I don’t tend to put much into overall or total volume because I have seen stocks rally easily on light volume. I do, however, care about high volume declines because they tend to be capitulatory (see the SMH decline in late July).
As I went through the charts this past weekend, it occurred to me how few stocks are at new highs, or even close to them. There used to be a statistic someone with much better computer skills than I have created about the number of stocks that were within 3% of their highs. The thinking being that the stock didn’t need to be at a new high, but close to it. I haven’t seen that statistic in years, but I recall it was helpful. My eyes say the number would be small.
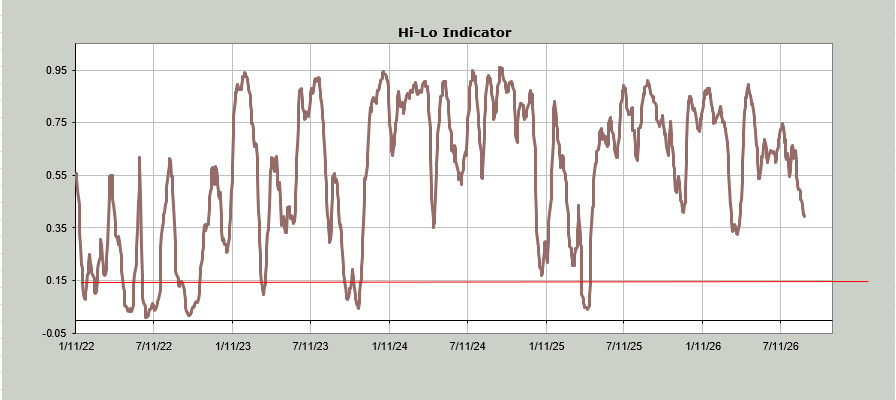
When we look at the NYSE Hi-Lo Indicator, we can see it is in a state of decline. It is rare to see it fall so rapidly and extensively with the S&P at/near its highs, mere pennies from a new high. This indicator is closing in on the same level it was in late March/early April. Prior to that, it was last here around Thanksgiving 2025. Both were terrific lows in the market. Both had seen the S&P falling, not rising into those oversold conditions.
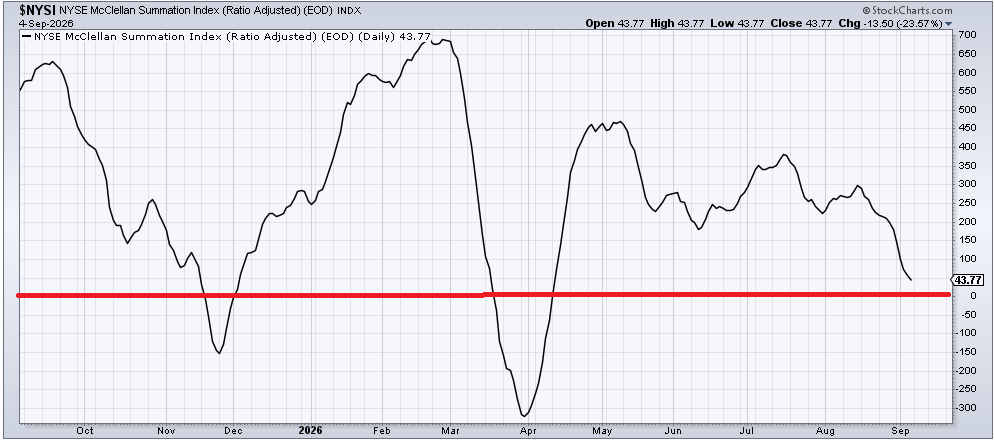
The McClellan Summation Index is similar in that it has been rapidly declining for three weeks now. But notice, while it is still not yet close to where it was in November or March, it has made a lower low by a decent margin.
An aside here is that you can see it is approaching the zero line (red). There is nothing special about the zero line except that my experience is that once we get this close to it, we typically break it. Sometimes it takes weeks for it to finally break it, often it has an uptick first, but I am hard pressed to find examples where it bounced in great fashion before breaking it.
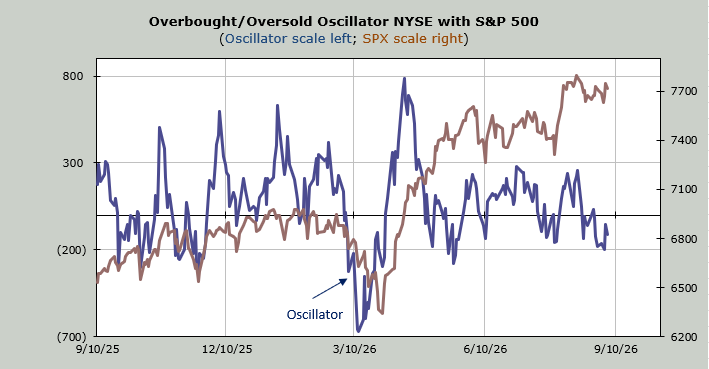
That brings me to the state of the current market. Short term, we continue to have an oversold condition, which you can see on the chart of the Overbought/Oversold Oscillator.
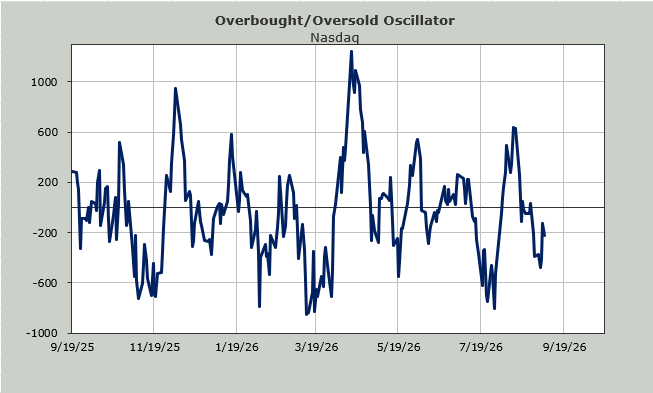
But we also have a market that is very complacent. In fact, it is also difficult to find other periods of time where individual stocks are so far off their highs and sentiment is so complacent.
With the DSI on Crude Oil at 87, perhaps we’ll get a shake-up in the market this week. Because right now we have an awful lot of dribbling and chopping.
