The Market Divided Into Two Parts
Let's take a close look at the short-term and intermediate-term — and the chances for a rally and/or a continuing correction. Plus, a look under the hood at Tesla and much more.
You've reached your free article limit
You've read 0 of 1 free Pro articles.
The Market
Let’s divide the market into two parts today, maybe even more than that. But let’s begin with two: there is the short term and there is the intermediate term.
How can we be short-term oversold? We are only a little bit short-term oversold. How can the DJIA not be short-term oversold when it has been red for five straight days and eight of the last nine trading days? That’s just math.
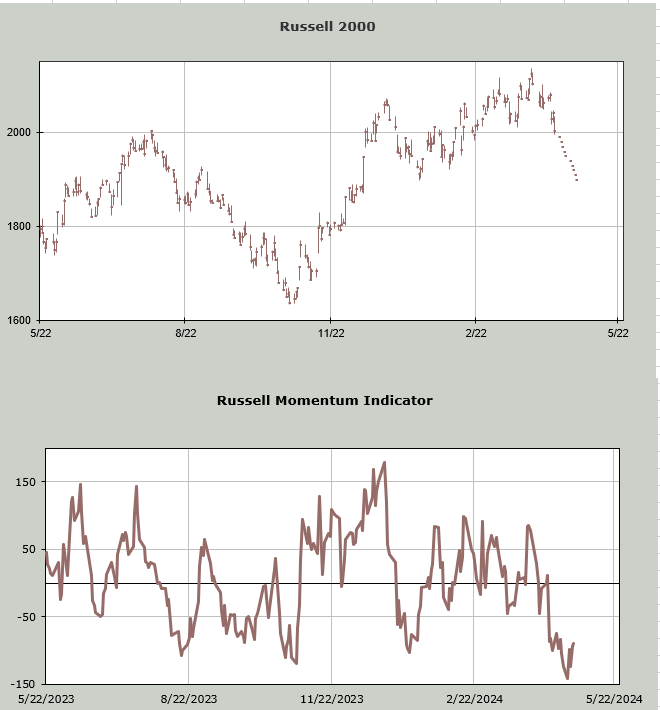
Clearly the small-caps are the weakest of the major indexes, having slid 6% in the month of April already. I have an indicator I haven’t discussed in a very long time, but it is a Momentum Indicator. Here I use it with the Russell 2000.
What I do is walk it down (top chart) 100 points over the next week or so to determine at what point the indicator (lower chart) not only stops going down but turns up. You can see there are no upticks in the price chart but by Tuesday of this coming week the indicator chart turns up anyway. That is the definition of oversold: when price goes lower but momentum turns up.
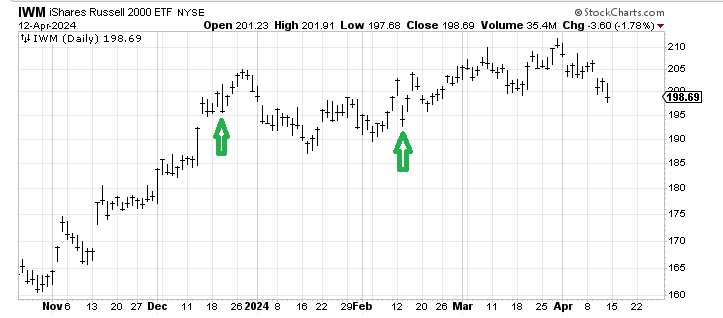
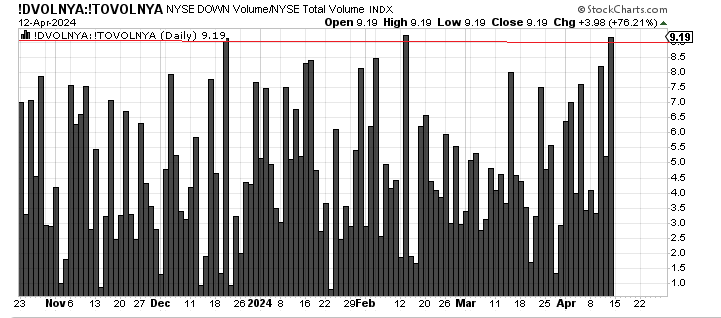
Friday saw 92% of the volume on the downside. That last occurred on February 13 and prior to that in late December. That tends to lead to a short-term rally. The green arrows represent those prior two instances.
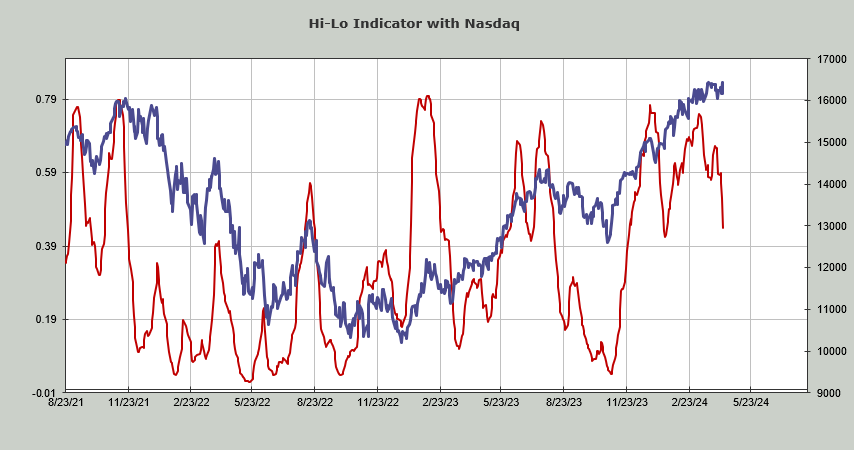
Now let’s talk about the intermediate-term indicators. They are not oversold. For example the Hi-Lo Indicator for the Nasdaq will probably set up for a small turn up this week but for a good, intermediate-term oversold reading that ought to be at the bottom of the page.
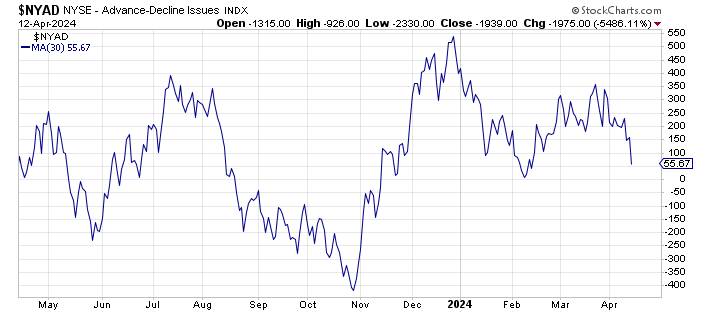
The 30-day moving average of the A/D line isn’t oversold. My estimation is that it will take a few more weeks for that to get to what I would term a good oversold condition. The Volume Indicator is still at 51%. It doesn’t get oversold until it gets into the mid-to-upper 40s. And of course the McClellan Summation Index is still heading down.
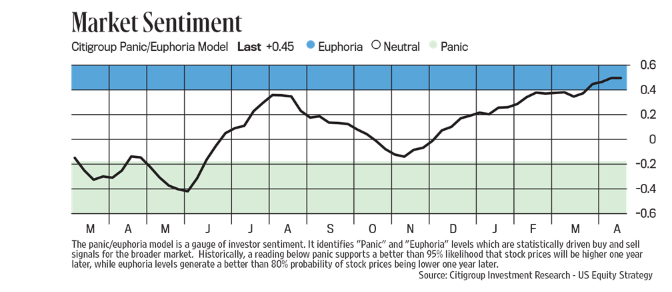
Then there is sentiment, which might have gotten a bit panicky on Friday but overall, remains complacent. None of the sentiment indicators I have shared with you recently have backed off in a meaningful manner. Heck, the Citi Panic/Euphoria chart is now at +.45. It was at +41 when I first showed it to you a few weeks ago.
I would not be surprised to see a short-term oversold rally this week but I still don’t think the correction is done. Perhaps the market will prove me wrong but step back and you can see the Nasdaq, despite not breaking 16,000, is where it was in February and the S&P 500 closed Friday at 5123, the same level it closed at on March 6.
New Ideas
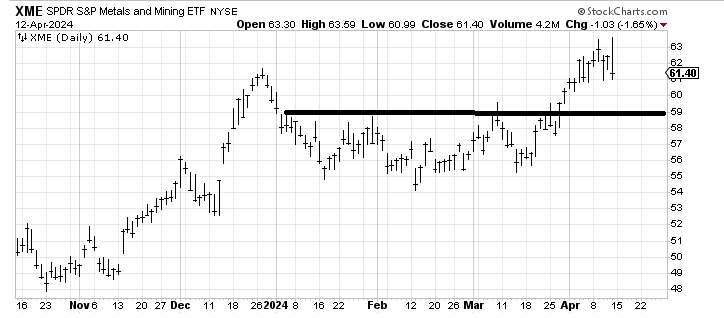
SPDR S&P Metals and Mining ETF XME hit its target of $63-ish not once but twice last week. I’m in favor of taking profits. I would like to see a push back toward $59-ish over the next several weeks for another good setup.
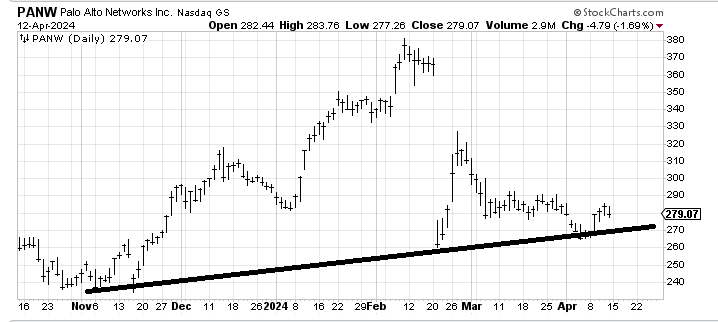
Palo Alto Networks PANW had a nice bounce from $270. It got stopped at resistance but I think that $260-270 area ought to hold on trips back down now. It will take time for it to eat through the resistance but I’d still be in favor of buying it near the lows.
Today’s Indicator
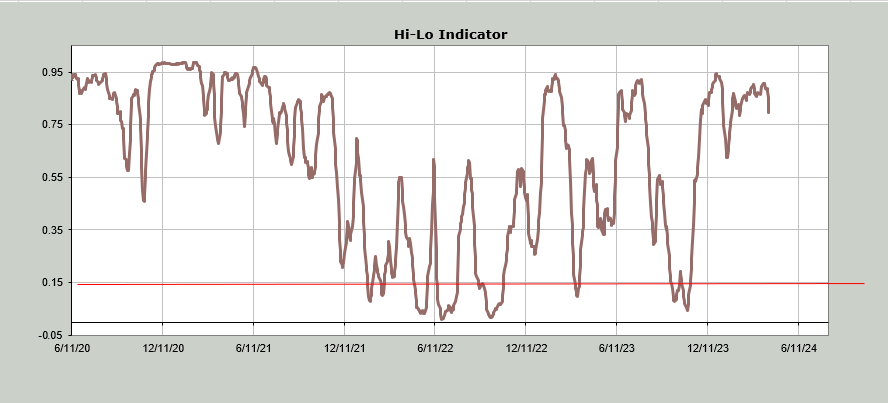
The Hi-Lo Indicator for the Nasdaq is discussed above. Now look at the NYSE’s Hi-Lo Indicator as it has finally rolled over so you can see it.
Q&A/Reader’s Feedback
Helene welcomes your questions about Top Stocks and her charting strategy and techniques. Please send an email directly to Helene with your questions. However, please remember that TheStreet.com Top Stocks is not intended to provide personalized investment advice. Email Helene here.
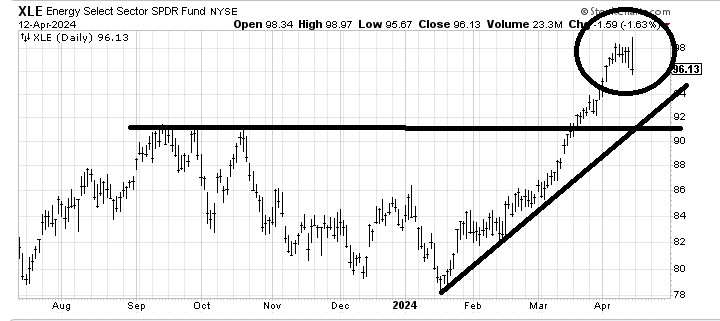
I am no longer bullish on energy. I had turned neutral a few weeks ago but the action over the last week in Energy Select Sector SPDR Fund XLE and VanEck Oil Services ETF OIH has me thinking it’s more likely XLE comes down to that $90-92 area than it goes over $100 now. We had a great run here. It’s time to move on.
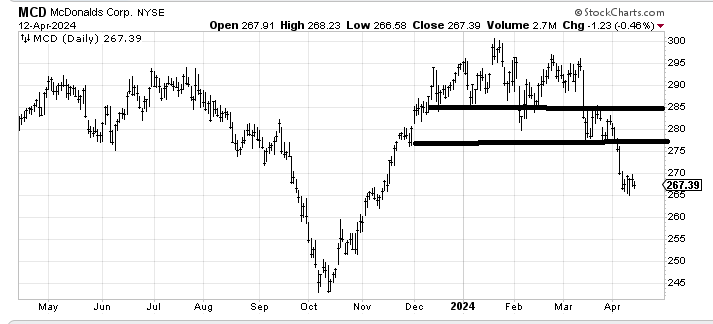
I was asked for a downside target on McDonald’s MCD. It measures into the $260-265 area. The best guess I have is that if we go get a DJIA short-term rally MCD can rally near $275 and then head back down. Perhaps by then we’d have the indicators more intermediate-term oversold. But if you are looking to cover your short, it’s time to take a little off the table.
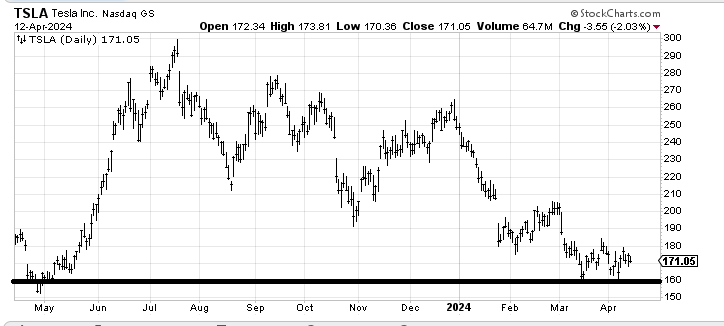
I had thought Tesla TSLA was oversold enough at $160 to rally to fill that gap in the mid-$180s. It couldn’t even get that far, missing it by a point or so. It did reaffirm the $160 level so if you want to bottom fish it for a trade then under $160 is your stop because if the stock breaks $160 after milling around here for a month or two it will bring into play that long-term downside target near $130.