Still Overbought, but Is Breadth Starting to Crack?
We're still waiting for that volatility to show up. And even though the big-cap indexes have held up, cracks are starting to form.
You've reached your free article limit
You've read 0 of 1 free Pro articles.
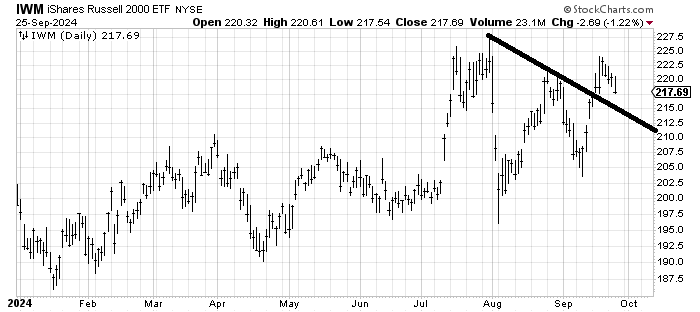
The big-cap indexes have held up quite well all week. And there has been no volatility to speak of despite my insistence we should have some. Unless of course you are looking at small caps because the Russell 2000 is down three percent since Thursday.
Last week I noted that each time the American Association of Individual Investors saw the bulls jump by more than ten points, the Russell suffered. What I had noticed was that since 2021, there had been eight instances of such a jump, and each time within a week or so, the Russell had given up a few percent. So now it’s nine out of nine.
The first support I see is around that 215 area.
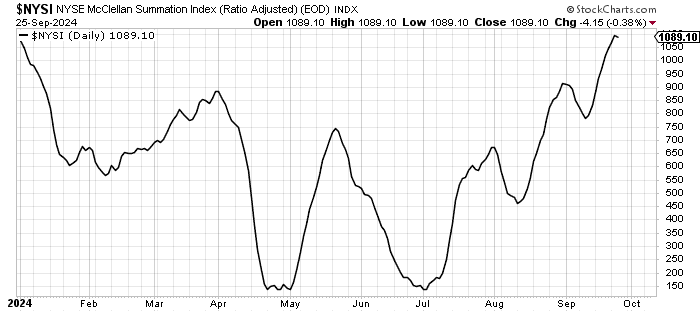
Then there is breadth. It’s been holding up this week, although it is no longer leading on the upside. On Wednesday the NYSE saw the worst breadth since early September. A mere 30% of the volume was on the upside on Wednesday.
It was enough to halt the rise in the McClellan Summation Index. If you squint hard, you can see the little downtick after Wednesday’s action. Now it needs breadth to be +600 or greater to get it to turn back up.
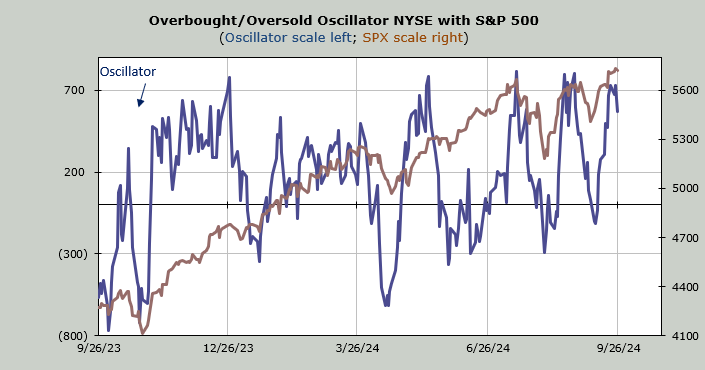
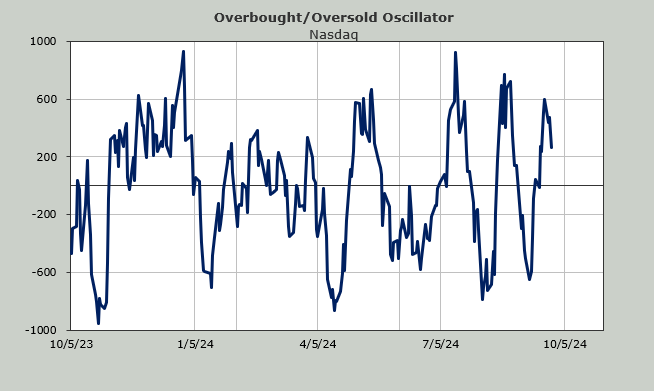
I would say that basically all those faltering new highs finally mattered. But as you can see on the Oscillator chart, we are still overbought.
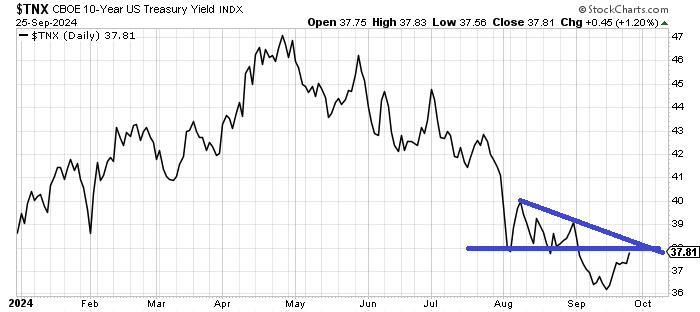
Interest rates have also crept back up. I have been looking for rates to head up for a few weeks now and so they have. This 3.80% area on the yield of the Ten-Year is an important level. My guess is it is resistance the first time up but so far I don’t see rates going much lower than they have. Not yet at least.
Then there is sentiment. Yesterday I said I didn’t think folks were giddy and I was asked about that considering the put/call ratio for equities was so low. It is my impression that as long as there is a heated debate over soft landing vs recession it is going to be difficult to get sentiment giddy as we saw it last summer.
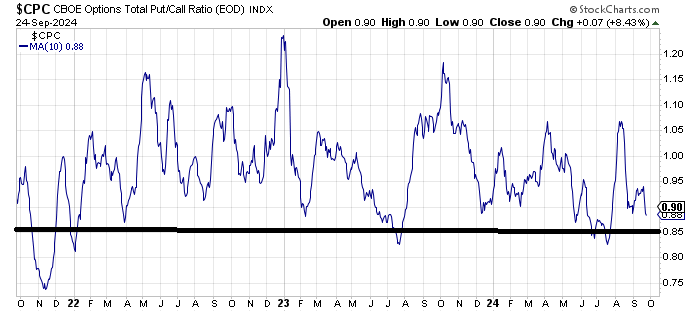
Earlier this week we looked at the ten day moving average of the equity put/call ratio. Today’s let’s look at the total put/call ratio’s ten day moving average. The one day reading was .76 on Wednesday which is the lowest reading since early September so I can say complacency is back. But look at the moving average. When it gets under .85 it’s not been great for the market. You can see the big low reading at .75 from November 2021 on the far left, followed by the reading just over .80 as we headed into January 2022.
Then there was the reading just under .85 in the summer of 2023 (just before a ten percent correction) and finally, this summer’s reading under .85 just before the early August whack.
The current reading is .87. A bout of volatility now ought to preclude a push under .85 but it’s worth watching.