Setting Up for a Repeat of Last February?
Insider Selling Plus Strong Sentiment Is Telling Us Something important.
You've reached your free article limit
You've read 0 of 1 free Pro articles.
In hindsight, everything is easy to spot. I thought about that this weekend as I stared at yet another type of sentiment indicator that says we’re getting overdone. This time it is the ratio of Insider selling. You can see on this chart from Barron’s it has surged, pushing itself into what they term ‘Bearish’ territory.
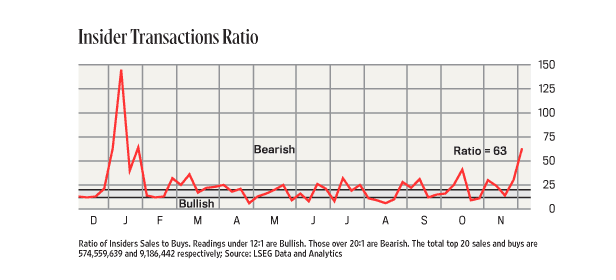
When this indicator surged in January last year, and I highlighted it as cautionary, I was bombarded with, “But that’s just Zuck (meaning Mark Zuckerberg of Meta) selling”. I scoffed, saying we should not rationalize an indicator. The peaks in this indicator do not line up perfectly with the S&P. In fact, they rarely do.
But step back and look at almost any industry chart and you will see that almost every group peaked in the first quarter of this year.
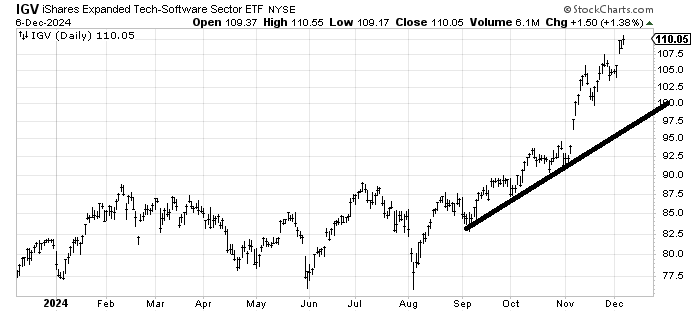
Let’s just look at the newly beloved IGV, an ETF to be long software. At the time we did not know that the peak in February was going to be it for the ensuing seven plus months. But it sure turned out that way. In hindsight maybe that Insider Selling was right.
Maybe you say to yourself but the semis were hot then. Notice they too peaked in the first quarter, about a month after software. Their sideways action turned out to be quite different than IGV, but they too had a two month correction and now find themselves right back where they were in March.
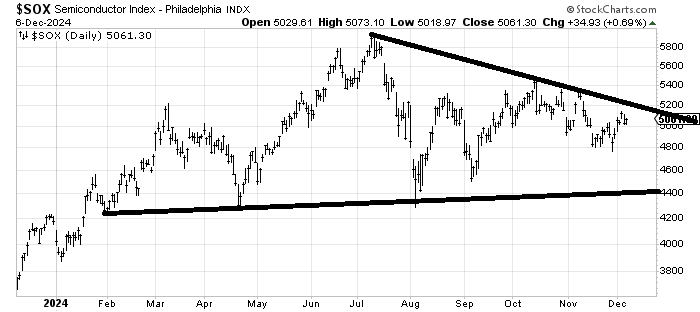
I can go through this with almost every group and what we’ll find is a peak in the first quarter. So maybe it wasn’t ‘just Zuck’ who was feeding the ducks last year? And maybe in hindsight, months from now we will look back and see a similar type of action: a peak within a few months.
We already have sentiment too bullish with the Investors Intelligence bulls kissing 63%. Even the American Association of Individual Investors (who are really day traders in my opinion) got bulled up last week with an eleven point jump in bulls to 48%.
The Citi Panic/Euphoria Model remains literally ‘off the chart’ at the Euphoria end. The various moving averages of the different put/call ratios are all sitting near the ow end of their ranges as well.
Last Thursday’s pullback got the Daily Sentiment Index (DSI) to back off from the 85 reading we saw. The S&P is now at 79 and Nasdaq is at 83. As a reminder, over 85 is a yellow flag and over 90 is a red flag.
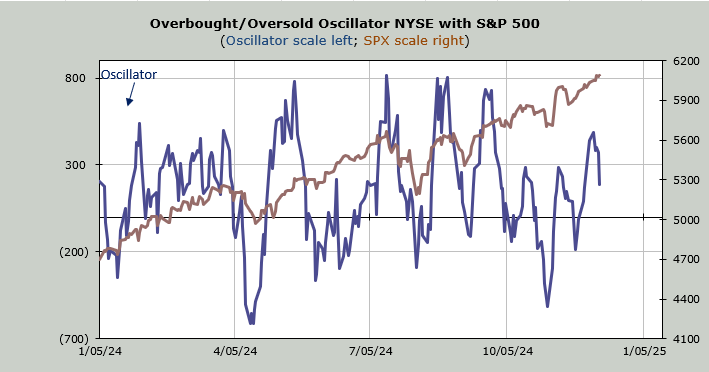
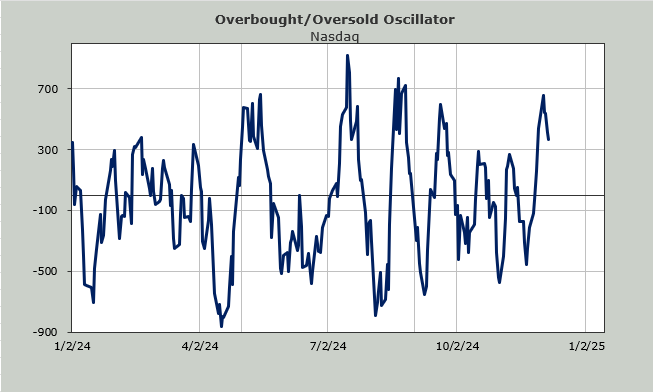
As for the overbought condition, you can see the Overbought/Oversold Oscillator has already rolled over and is heading back down. The only ones who don’t care is the S&P and Nasdaq because the Index movers were the only game in town last week. Nearly everything else backed off as breadth was negative four of the five trading days and the one day it was positive was by a mere 50 issues.
My view is still that we should get a bout of volatility early this week and then rally again later in the month. However that chart of Insider selling coupled with all the too bullish sentiment tells us that we should expect an awful lot of stocks to peak in the next month or so.