September Sends Chills Down Wall Street
Troubling jobs trends continue, as we look forward to ... October, and, boy, if that month decides to get ugly ...
You've reached your free article limit
You've read 0 of 1 free Pro articles.
It wasn't really so long ago. Just four business days ago, in fact, when we were still talking about that ridiculous "month-end" mark-up that let traders and investors head into their Labor Day weekends, feeling a little rich. That's a far cry from how many of these traders and investors felt headed into the weekend that just ended. Four straight-down days for the S&P 500. Oh, September does have its reputation my friends, we've gone over that before.
It is not for lack of reason that investors traditionally enter September a little heavier in cash than they otherwise might. On the bright side, September is September, and October is October. October, mind you, usually does post positive returns for the month. But just some fair warning ... when October wants to get ugly, there is no month more severe in its judgement. For when October gets angry -- and some readers might be too young to remember -- standards of living can take years to recover.
The Week That Was ... Ugly
The Ugly Stick was out and about last week. No way to sugarcoat that. The S&P 500 gave up 4.2% over four days, making the week the worst for our beloved market's broadest large-cap index since March of 2023. The S&P 500 got off sort of easy. The Nasdaq Composite was slapped around for a beating of 5.77%, making last week the worst week for the "Nazzy" since January of 2022. That's like 33 months. Been a while. Tech led the way south for equities and the semis led tech. Oh joy.
Equities did not sell off alone. Several commodities sold off on recession fears, as well, despite a U.S. Dollar Index that weakened throughout the week. WTI Crude literally saw its year-to-date gains evaporate as what was once known as "black gold" traded below $67.50 per barrel on Friday after trading above $74 earlier in the week. Gold hung tough and actually gained some ground throughout the four-day period. Bitcoin was not quite as fortunate.
The negative price discovery for the week, was really the product of some soft macroeconomic data throughout the four days that rattled a few cages. The week of course was capped off by the release of the twin employment surveys for August on Friday.
The Macro: Signs of Stagnation, Contraction
The week started off with a just dreadful ISM Manufacturing PMI for August that showed not just stagnation, but severe contraction across many components, including new orders and employment. The survey also showed that despite the slowing activity, manufacturing-focused prices were accelerating again. On Thursday, the ISM Service Sector PMI still printed in a state of expansion, which is a positive, but it did show that the pace of hiring was slowing and that prices here, too, were accelerating again.
The rest of the week's macro, with the exception of a rather ominous sounding Fed Beige Book on Wednesday, focused more on labor markets than anything else. First up was the release of the job openings and labor turnover report for July. Though dated, the JOLTs release showed fewer job openings across the nation for July than for any month since January 2021. Job quits were up slightly, but June and July were the quietest two months in terms of job quits in the U.S. since November 2020. On Thursday morning, the ADP Employment Report informed us that August had indeed been another tough month for labor markets, which set up the big event on Friday.
August Jobs Wobble
Non-farm payrolls print, which is drawn from the establishment survey and considered to be the headline print for the release, hit the tape at growth of 142,000 (salted, peppered and seasoned to taste). Consensus had been for something closer to 163,000 jobs created, so this was a significant miss. Then come the revisions. When considering the downward revisions of 25,000 jobs created for July and 61,000 jobs created for June, the net jobs created in August, according to this survey, becomes just 56,000 -- that's way, way below expectations when one realizes that the above-mentioned consensus view for growth of 163,000 jobs was created ahead of those 86,000 jobs that were removed from the past two months.
For once, the job creation number in the household survey outperformed the non-farm payroll print. According to this survey, the economy added 168,000 newly employed persons in August, up from just 67,000 newly employed folks in July. The number of newly unemployed persons decreased by 48,000 as the number of folks outside of the labor force increased by 91,000.
Nationally, the unemployment rate improved to 4.2% from 4.3% in July, while the underemployment rate went the other way, yet again, rising from 7.8% to 7.9%. Participation remained steady at 62.7%, while the employment to population ratio held steady at 60.0%.
Troubling Trend Continues
The number of people working part-time for economic reasons increased by 264,000, while the number working part-time for other than economic reasons increased by 525,000 individuals. In short, people working part-time increased by 789,000, while net job growth ran 88,000.
The U.S. economy has been hemorrhaging full-time jobs for more than a year now, and that trend continues. Remember, when they report average workweek, that's only full-time employees, so the worker who has been downgraded from full to part-time by their employer does not count against that average.
In short, people working part-time increased by 789,000, while net job growth ran 88,000. The U.S. economy has been hemorrhaging full-time jobs for more than a year now, and that trend continues.
Marketplace on the Wrong Side of Bed
September got out on the bad side of the bed last week. We'll throw some fun with charts at you in a minute or two...
- The S&P 500 gave up 1.73% on Friday to close the week down 4.25%.
- The Nasdaq Composite gave up 2.55% on Friday to close the week down 5.77%.
- The Nasdaq 100 gave up 2.69% on Friday to close the week down 5.89%.
- The Russell 2000 gave up 1.91% on Friday to close the week down 5.69%.
- The S&P Small Cap 600 gave up 1.72% on Friday to close the week down 5.26%.
- The S&P Mid Cap 400 gave up 1.39% on Friday to close the week down 4.92%.
- The Dow Transports gave up 1.22% on Friday to close the week down 3.84%.
- The Philly Semiconductors gave up 4.52% on Friday to close the week down 12.22%.
- The KBW Bank Index gave up 2.57% on Friday to close the week down 5.47%.
On Friday, ten of the eleven S&P sector SPDR exchange-traded funds closed in the red with the real estate investment trusts XLRE ending the session unchanged. The four defensive sectors closed the day in the top four slots on the daily performance tables, while Technology XLK led the selloff at -2.59%.
For the week, nine of the eleven S&P sector SPDR ETFs closed in the red, with the Staples XLP leading the winners, gaining 0.48%. The four defensive sectors took the top four slots in the weekly performance tables as well as for the daily tables. Again, Technology led the selloff at -7.45%. Energy XLE also had an awful week at -5.77%.
Do You See What I See?
Do you see a day-one on elevated trading volume on Tuesday, Sept. 3, and a "follow-through" day on elevated trading volume on Friday, Sept. 6?
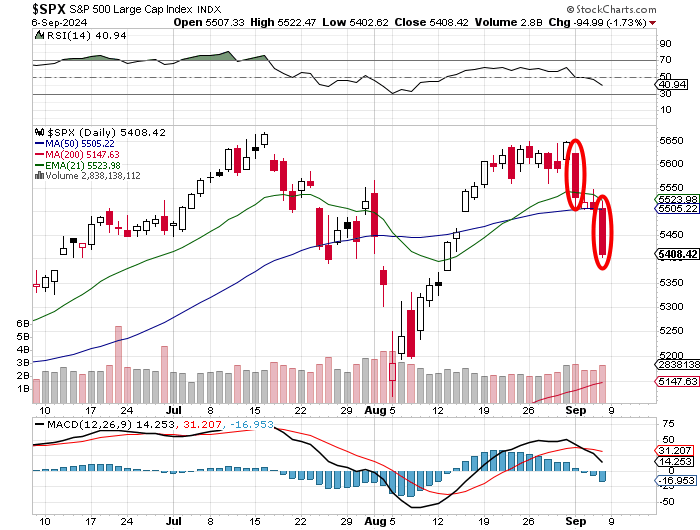
You do have the two-day break that we like to see. Do you see the cross-under of the 26-day line by the 12-day line within the daily moving average convergence divergence indicator? Do you see the "double top" reversal pattern? I do believe that we may have all of the ingredients for perhaps a change in the trajectory for market performance. I would like to be wrong about this.
It Should be Noted...
As I work my way through the zero-dark hours on Monday morning, U.S. equity index futures are trading higher despite weakness across Asia and Europe. The U.S. Dollar Index is rising. Treasuries are selling-off, while WTI Crude has found a bid. Gold is slightly lower, as capital is moving back into Bitcoin.
Un-Inverted
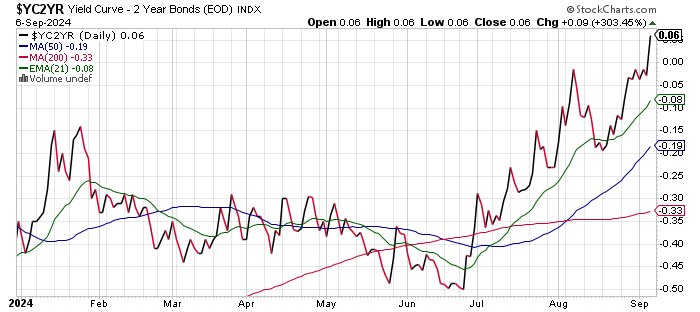
Finally, by Friday afternoon, after flirting with doing so all week, the spread between the yields for the U.S. Ten-Year and Two-Year Notes un-inverted or "normalized." Is that a good thing? In the long run, I guess so. In the short to medium term? Not exactly. While normalization is healthy, when doing so after a lengthy period of inversion, it almost always precedes recession, and in turn... lower asset prices.
Readers will see here that this spread went out last week at positive 6 basis points:
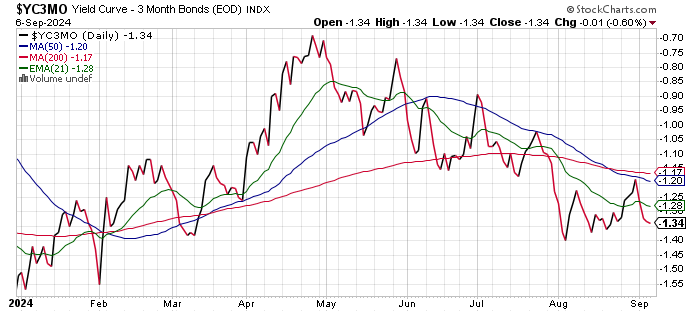
Keep in mind as well, that for most economists, including those at the Fed, the far more important spread in terms of predicting economic trouble is the one between the U.S. Ten Year Note and Three-Month T-Bill.
This spread not only remains inverted, but has shown no signs of moving toward a normalization...
The GDP Game
Last week, the Atlanta Fed revised their GDPNow model for the third quarter up to growth of 2.1% (q/q, SAAR) from 2.0%. Among other regional Federal Reserve district banks running close to real-time gross domestic product models for the current quarter, the New York Fed has the third quarter humming along at 2.61%, which is now the most optimistic model. The Cleveland Fed still shows growth of 1.61%, and the St. Louis Fed shows growth of 2.06%. The St. Louis Fed was the most accurate among the four models for the first quarter, while Atlanta was the most accurate for the second. Expect Atlanta to revise their model later this morning after the Census Bureau revises its Wholesale Inventories print for July.
Earnings & Valuation
Obviously, we are currently in between earnings seasons. The crew at FactSet is back at it after having taken a late summer break. This is a good thing, because I do rely on FactSet. According to FactSet, for the second quarter, the S&P 500 reported earnings growth of 11.3% on revenue growth of 5.3%. 79% of S&P 500 members reported earnings beats, while 60% of S&P 500 members beat revenue projections. Utilities and technology were the only two sectors to show earnings growth of more than 20%, while the industrials and materials were the only two sectors stuck with an earnings contraction.
For the third quarter, still using FactSet as my guide, S&P 500 earnings are projected at growth of 4.9% and revenue growth is seen at 4.8%. Technology is seen growing earnings by 15%, well ahead of the pack, while Energy is seen suffering an earnings contraction of 13.8%.
The S&P 500 will enter the new week trading at 20.6 times forward looking earnings, which remains well above the five (19.4 times) and ten-year (18 times) averages for the index. The most highly valued sectors are currently Technology and the Discretionaries at 27.3 times and 24.2 times respectively, while the Financials and Energy are the least valued at 15.9 times and 11.8 times in that order.
Additions & Deletions
S&P Dow Jones indexes will implement their quarterly rebalancing / reshuffling after the closing bell on Sept. 20. After this past Friday's closing bell, the announcement concerning who's going where, was made. Entering the S&P 500 will be Dell Technologies DELL, my personal favorite name... Palantir Technologies PLTR and Erie Indemnity ERIE. Dropping from the S&P 500 will be American Airlines AAL, Etsy ETSY and Bio-Rad Laboratories BIO.
Etsy will be dropped down to the S&P Small Cap 600 as Haverty Furniture HVT gets the boot. American Airlines will drop down to the S&P Midcap 400, as Tegna TGNA gets the boot, and Bio-Rad will replace Erie Indemnity in the S&P 400.
The Week Ahead
A whole five-day workweek lies ahead. While that at this time may seem daunting, and the position of our equity markets in peril, there probably is not a lot to focus on. What's important will be very important, so I don't know if that makes one's life any easier, but it might be easier to drill down on the specifics.
The earnings calendar will be especially light this week and the Fed has gone into its blackout ahead of next week's policy meeting. Still Oracle ORCL reports tonight and GameStop GME tomorrow night. Kroger KR will post its numbers on Thursday morning, and we'll hear from Adobe ADBE and RH RH on Thursday evening.
As far as corporate events are concerned, Apple AAPL will hold its September launch event today. A new AI-infused iPhone 16 containing a next generation A18 chip based on architecture provided by Arm Holdings ARM is expected to be the event's star. Additionally, the DOJ's second antitrust trial against Alphabet's GOOGL Google unit will begin later today amid claims that the tech giant operates something close to a monopoly in the on-line advertising market.
I don't really know if there is market risk associated with the presidential debate, but investors need to be fully cognizant that former President Donald Trump and current Vice President Kamala Harris will square off on Tuesday as the presidential nominees of their respective parties in what may be the only debate between the two ahead of Election Day.
Concerning this week's macro, the main event will be the readings for August consumer price index to be released on Wednesday morning. That will be followed by August producer price index on Thursday. The U.S. Treasury will "raffle" off $39 billin worth of new Ten-Year Notes on Wednesday afternoon and $22 billion worth of new Thirty-Year Bonds on Thursday afternoon.
Economics (All Times Eastern)
10:00 - Wholesale Inventories (July): Expecting 0.3% m/m, Last 0.1% m/m.
3:00 p.m.- Consumer Credit (July): Last $893.
The Fed (All Times Eastern)
Fed Blackout Period.
Today's Earnings Highlights (Consensus EPS Expectations)
After the Close: ORCL (1.33), RBRK (-.49)
At the time of publication, Guilfoyle was long PLTR equity.
