Rising Rates Are Beginning to Hit Stock Returns
Rates have been moving higher lately. How have they impacted stocks?
You've reached your free article limit
You've read 0 of 1 free Pro articles.
Let’s talk about the month of October. Apparently, the narrative was that it was pre-election and so October was supposed to be a month of sitting on the sidelines. Yet, here we are with the S&P mere pennies off the high and while Nasdaq is still well off its high, it too has been headed upward.
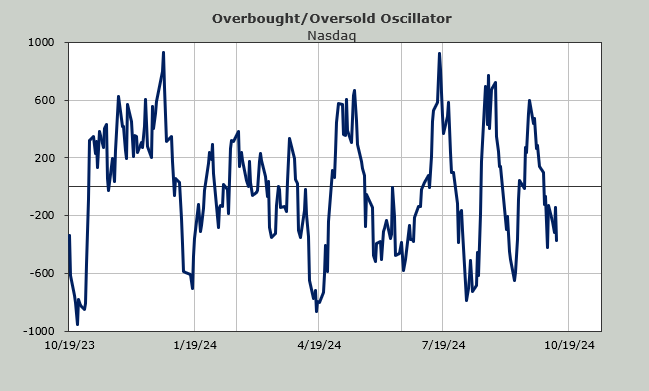
Yesterday, I noted how the Utes were down four percent. So are the REITs. But did you know that in the month of October, Nasdaq’s breadth has been positive exactly two days? And one of those days it was +60.
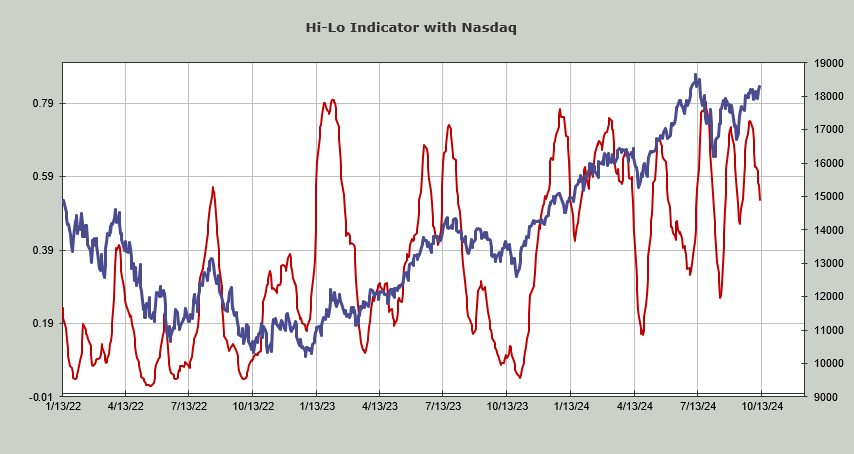
Also in the month of October, Nasdaq has had exactly two days where there were more stocks making new highs than new lows. It’s kind of hard to make a case for expanding breadth when the statistics say otherwise.
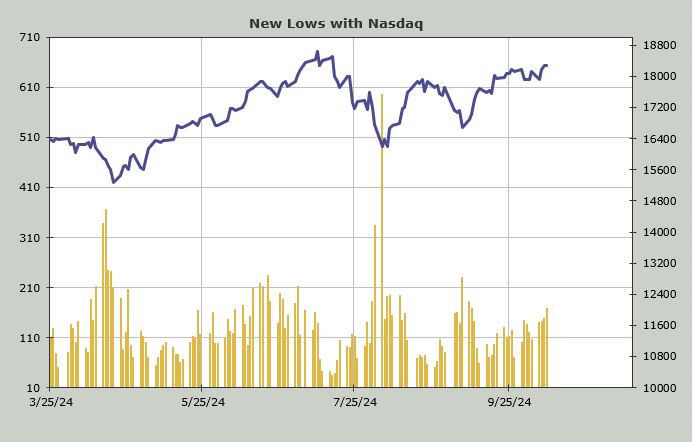
Take a look at the number of stocks making new lows on Nasdaq. Now, hone in on the month of October. Do you see this chart heading up? And do you see how Thursday was yet another increase? It’s easier to find stocks making new lows than new highs.
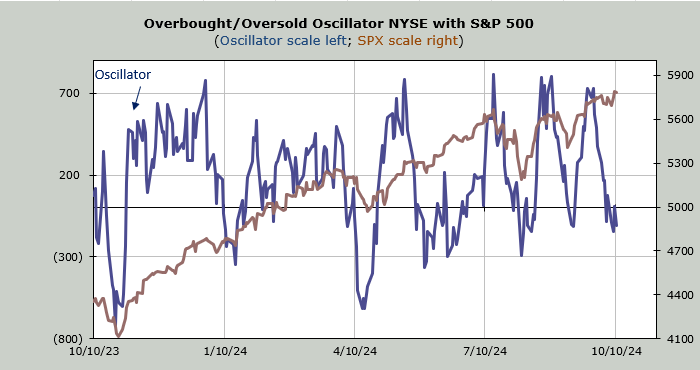
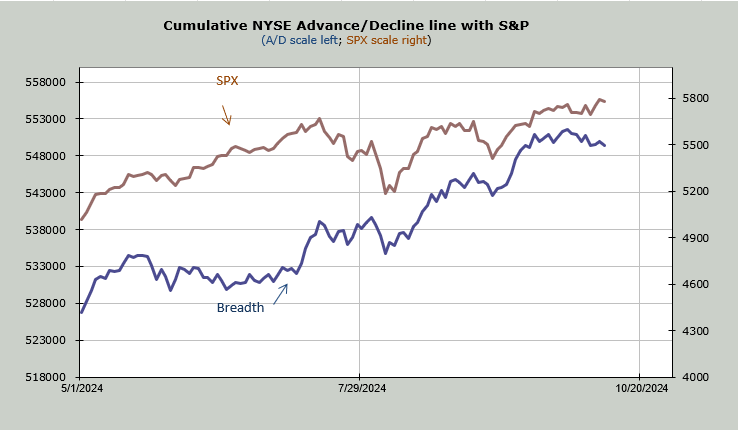
Yesterday we looked at the chart of breadth with the S&P. Here it is again. Notice how in the month of October, the blue line (breadth) has headed lower while the S&P (brown line) has headed higher? So much for all that broadening out we saw in the third quarter.
About the only good news I can conjure up from this is that the Hi-Lo Indicator is now at .53 so at least this indicator is heading toward an oversold condition.
While we don’t see the effect of higher interest rates on the indexes we are clearly seeing it in stocks. I suspect all this lack of breadth in the last month has to do with rates backing up.
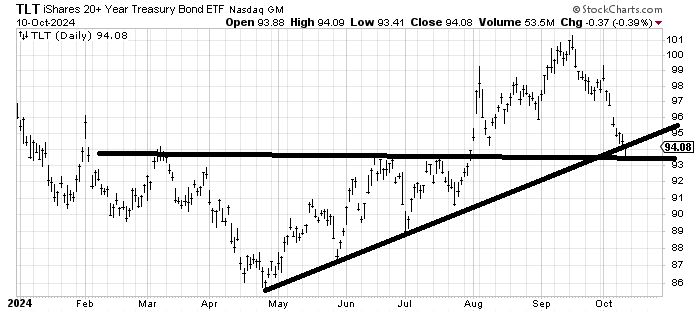
We have been looking at interest rates using the yield on the 10-year. But let’s use TLT instead. They tried to take TLT down on that higher than expected CPI reading on Thursday and TLT closed at the high of the day, and just a smidge over 94. It also bounced off that flat support line. I said two days ago I expected bonds to rally from this area (4.10-4.20% on the 10-year) and the chart of the TLT just shows it a different way. I think rates should back off from here and that means TLT should rally.
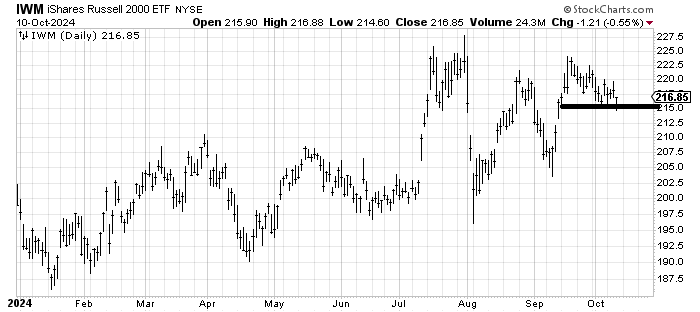
You know what else closed at the high of the day? IWM. I’d like you to look at the chart of TLT and IWM together since August. You see the surge in TLT as IWM plunged in early August? But since then, the two charts have had the same shape, meaning when TLT rallies, so does IWM, and when it goes down, so does IWM.
Both topped in mid-September. IWM bounced off 215 again on Thursday. If TLT can rally from here, maybe IWM can rally a bit too. We need something to get us out of this NVDA only market.
Sentiment, though, remains a problem, and on Thursday, we saw the Daily Sentiment Index (DSI) for the VIX back at 15.