Nasdaq's Hits New Lows Milestone Amid Overbought Deadline
Does the overbought condition matter? For the retailers, it sure does.
You've reached your free article limit
You've read 0 of 1 free Pro articles.

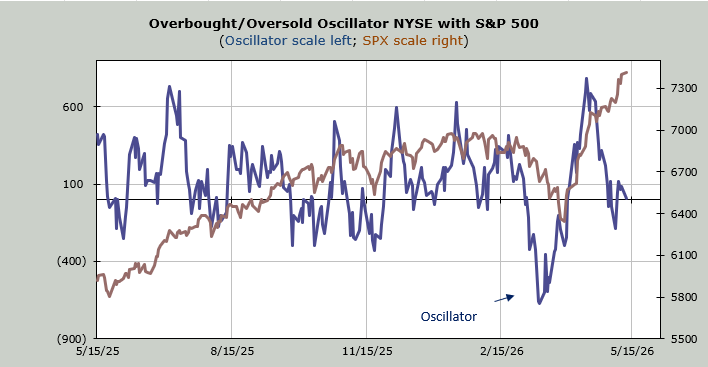
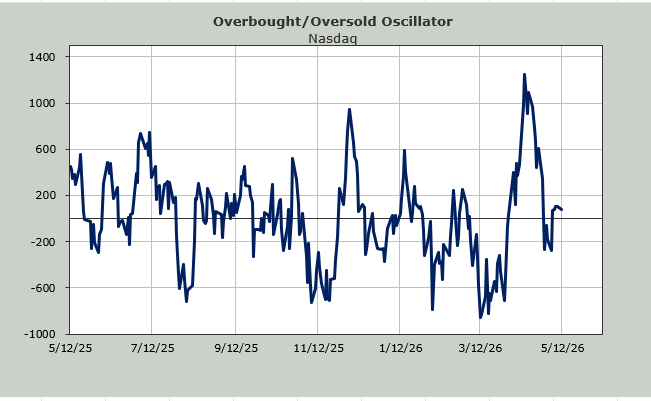
Here we are. It’s mid-May. For weeks now, I have been earmarking mid-May as the time period for us to get intermediate-term overbought. Many will ask if it matters. So, will it matter?
Well, since the SOX is now close to 20% of the S&P, I will reiterate that the S&P is the semis, so if the semis don’t come down, then no, it is unlikely to matter to the S&P (or Nasdaq).
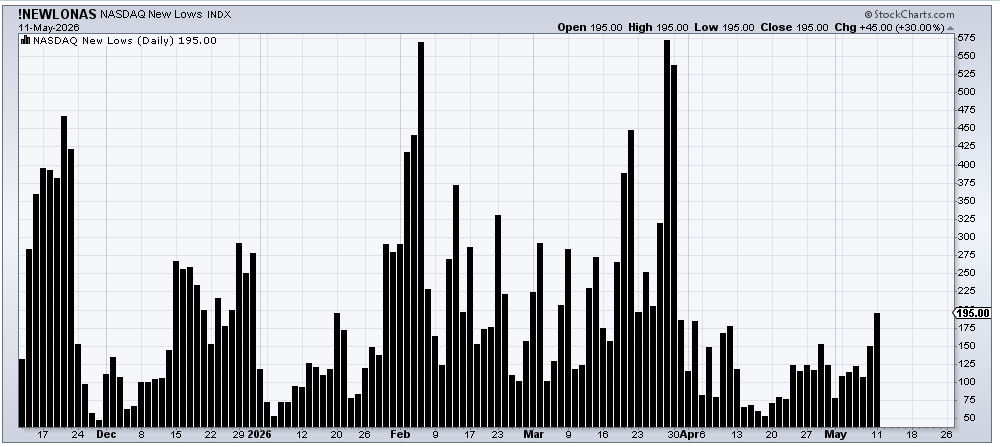
But breadth was negative on Monday. It still wasn’t negative enough to roll the McClellan Summation Index over. But here’s where the change took place: the number of stocks making new lows increased.
For weeks I have highlighted the new highs and their lack of increase, but the new lows on Nasdaq hovered around 120. While I consider that high for a market that goes up a gazillion points a day, it was steady. I said that if we see the new lows get into the 200 area, that would be a concern. Markets are funny that way, aren’t they? Just as mid-May is upon us, Nasdaq’s new lows expand to that 200 area.
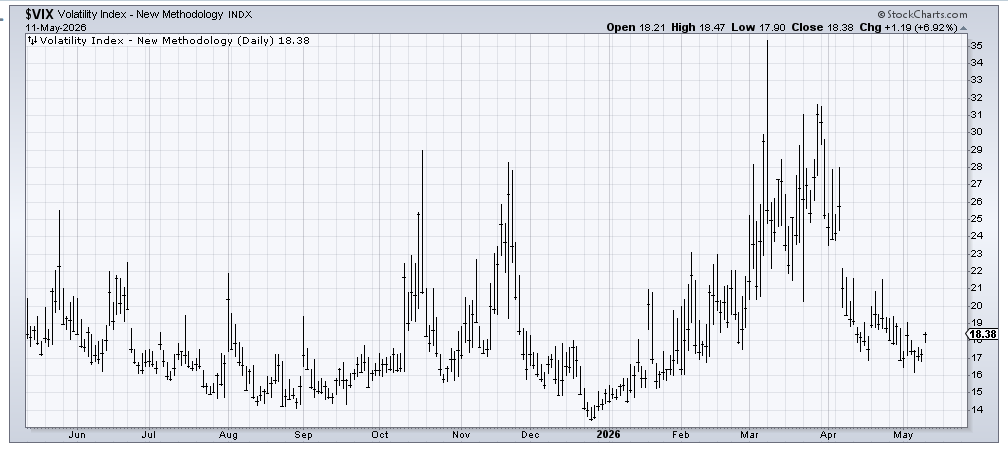
I also thought the VIX was poised to "rally" and, lo and behold, the VIX had quite a rally on Monday as it gapped up and stayed elevated all day. It may come down on Tuesday but I maintain that we should be in for a bout of volatility.
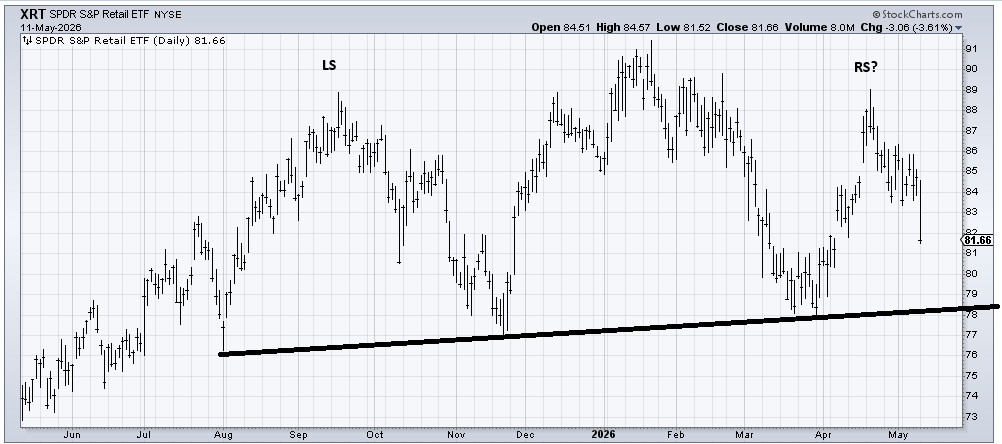
So, does the overbought condition matter? Have you seen the retailers? It sure matters to them. I feel as though the head-and-shoulders top is so "textbook" that everyone must surely see it (they tend not to work when everyone sees them). But the (XRT) is now down 10% in less than three weeks. That’s not a market that is ignoring the overbought condition, is it?
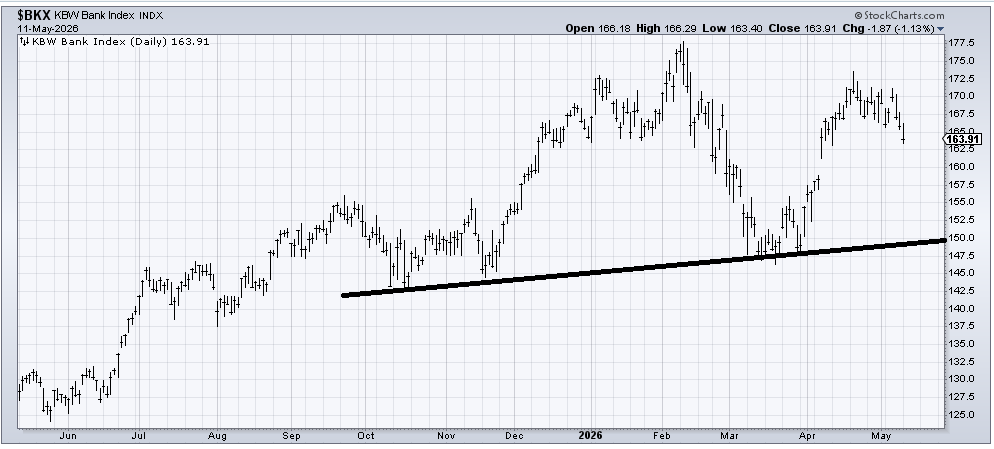
I have been harping about the banks for weeks now so I may as well do it another day. This too looks like a chart that cares about the overbought condition, doesn’t it?
I continue to anticipate that the ISE call/put ratio’s 21-day moving average will peak this week. Let’s go back in time for a minute.
Recall when I noted how the ISE Equity put/call ratio was all of a sudden under 2.0 on a daily basis? Well 21 days ago was when that stopped. Twenty-one days ago, that indicator stopped printing readings under 2.0 and it hasn’t printed a reading under 2.0 since. That is why I expect that indicator will halt the rise this coming week. It gets harder to replace big numbers with bigger numbers.
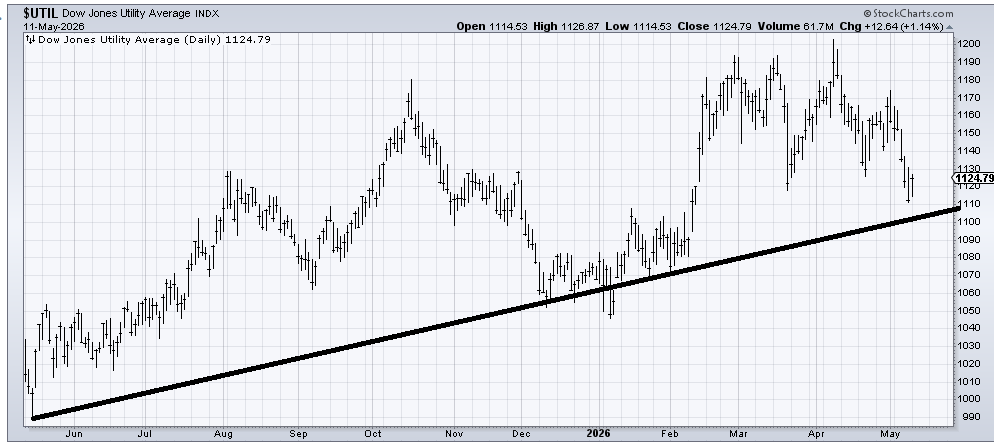
But hey, at least the utes bounced from support!