Let Me Show You Why This Is Different Than April
Not all market pullbacks are alike — and this one may have more to go. Let me show you why by looking at the S&P, the VIX, the Utes, Lam Research, Amazon and more.
You've reached your free article limit
You've read 0 of 1 free Pro articles.
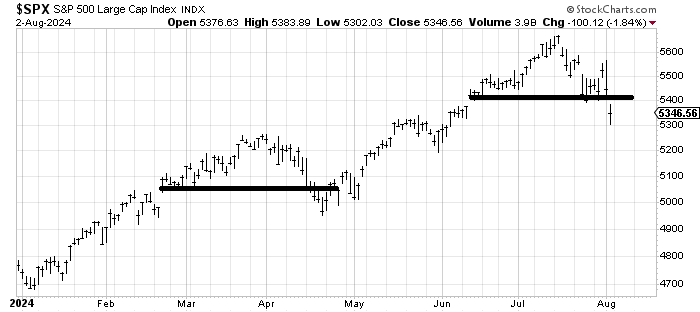
There will be, already is, a strong desire to compare this decline in the markets to the one we saw in April. I am already seeing the perma bulls remind us that it is standard for us to have X number of 5-10% pullbacks each year. This is true, but not all pullbacks are the same.
Take a look at the chart of the S&P 500. One might say that the break of 5100 in mid-April is the equivalent of the break of 5400 last week. I wouldn’t argue the point. But look closely at the April decline. What you do not see are gaps. For the most part it was a rather gentle pullback that got a little violent toward the end.
What you see in the last few weeks is not one but two gaps down. That’s what’s different to me.
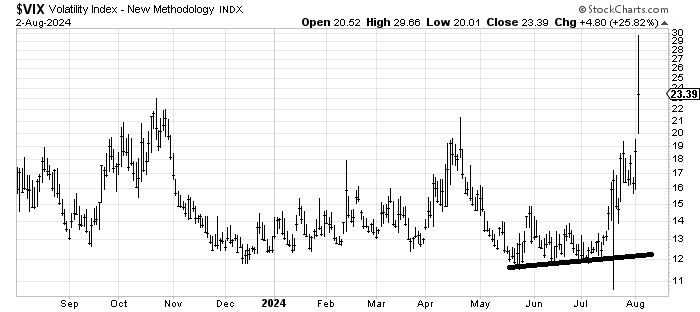
Take a look at the VIX. A week ago I explained how the VIX ought to pull back and then rally again, enough to look jumpy (more on that below). But even if you are not a chart watcher, I think you can see how different this move in the VIX looks vs. April.
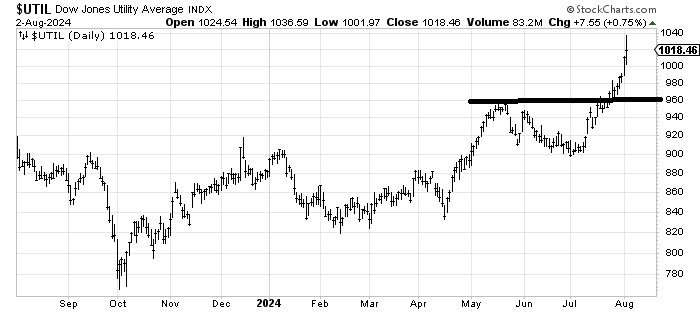
In April the Utes corrected with the market, now they are surging, doing their best imitation of a tech stock. Also different.
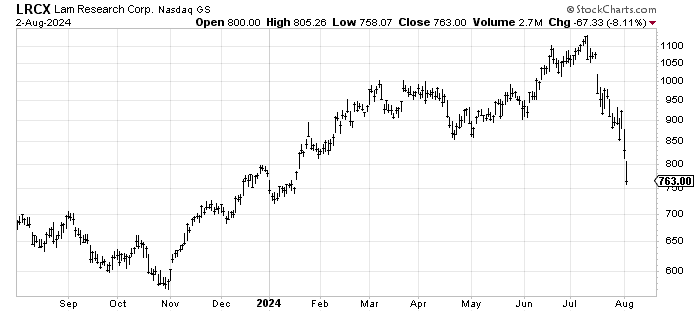
Then there are some individual stocks. We all focus on Nvidia NVDA but have you looked at Lam Research LRCX lately, another member of the SOX? That does not look like the April decline. It is now down on the year, having given up all of its gains on the year in two weeks. It barely took a breath to stop at support/the prior low. So not like April.
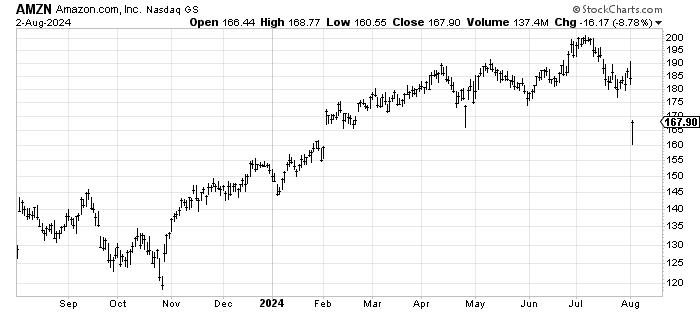
Or how about Amazon AMZN? At first glance, maybe Friday’s action looks similar to that low in April. It might turn out the same way if it gaps up Monday and doesn’t look back. But notice how in April it stopped right at the prior low (from February). This time it broke its prior low and filled the gap. Filling the gap should be short-term positive (for a bounce) but in April many wanted that gap fill from February and never got it — a sign of strength. But also different than now.
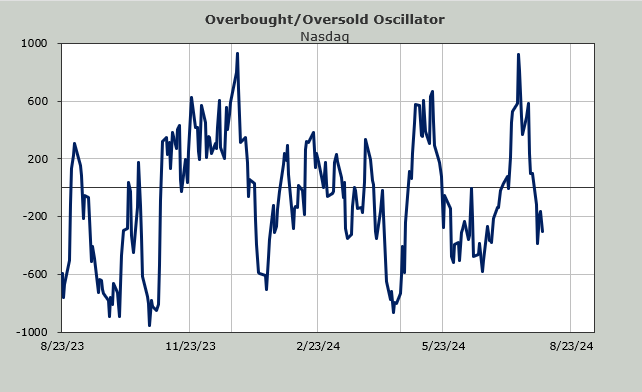
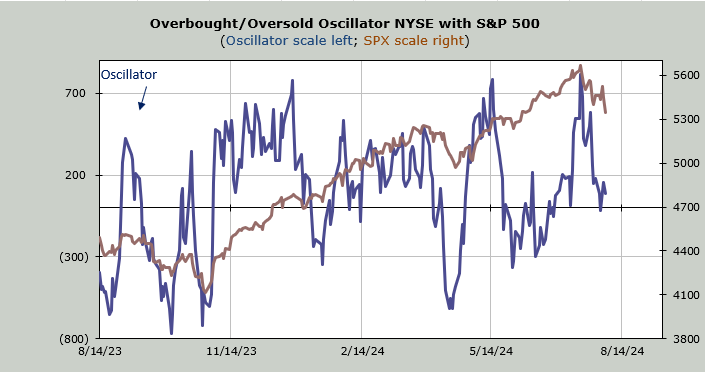
To me this does not look like the April decline. But we are a tiny bit short-term oversold. The VIX does look jumpy. The volume in the QQQs is the highest it has been since April (it was higher in April). And midday, although not at the close, we saw downside volume get over 90%. This tends to lead to a short-term bounce.
Yet the intermediate-term indicators only got overbought last week so that tells me there is more time to go in this correction.
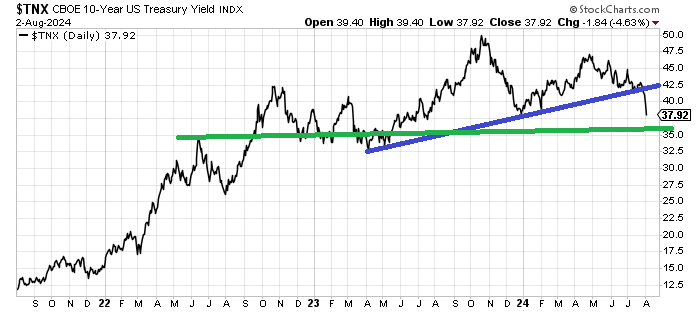
One final word on the bonds. As noted last week, we finally got the break of that uptrend line. There is good support around that green line (3.5-3.6%). However, the Daily Sentiment Indicator (DSI) is now at 86 on the bonds. The boat on "lower rates" has gotten a bit stretched here so I’d guess we see a short-term peak in bonds (and that includes the Utes) this week.