Is This Ratio Signaling a Correction Is in the Offing?
That reading doesn't often get down that far.
You've reached your free article limit
You've read 0 of 1 free Pro articles.
We’ve lately seen a lot of so-called signs that the rally is long in the tooth. There are the stats that the S&P has gone more than 30 trading days without a 1% correction but that’s not what I’m thinking about. I’m thinking about where sentiment is and where the indicators are.
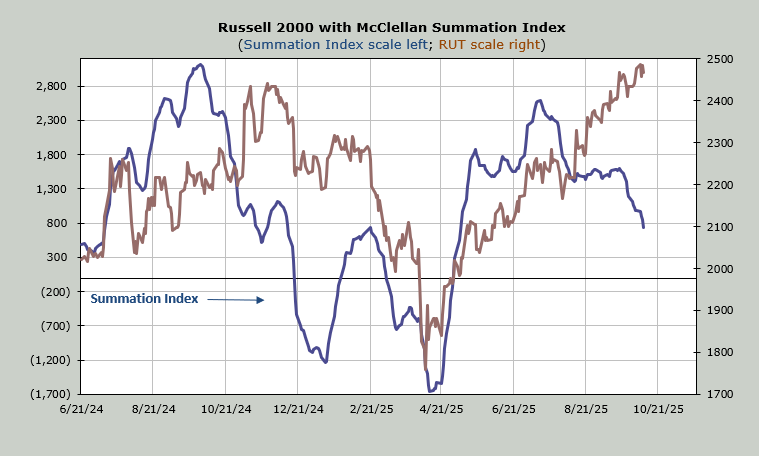
The indicators, as I have said, have mostly not participated in the rally since August. The McClellan Summation Index, which I believe represents the majority of stocks, went sideways for six weeks, and then instead of firming up it went down and is still heading down.
The number of stocks making new highs has not increased, which tells us the market is getting narrower, not broadening out as everyone seems to think. I believe the view is that if money is not flocking into the Mag 7 on a daily basis (it is not), then we must be broadening out.
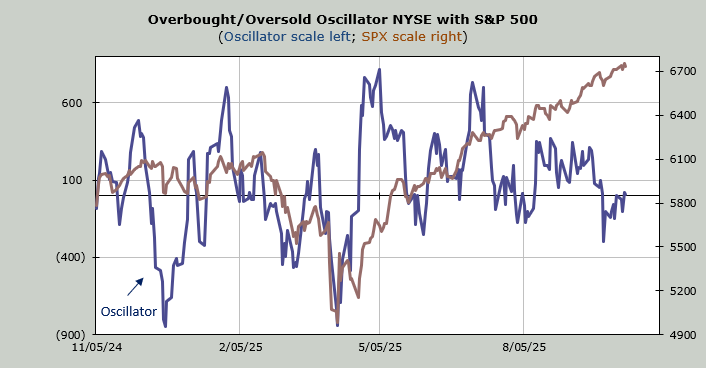
About 3,000 stocks trade on the NYSE. In the past 10 trading days we have had only two quadruple-digit readings, which is unusual for a market that has seen the S&P relentlessly rise. One of those readings was Thursday. And of those 10 trading days, breadth has been up five days and down five days.
We have seen the majority of the market leaders falter. I’ve gone on about Amazon and Meta, but when the S&P made a new high a few days ago, not one of the 10 largest (by market cap) stocks made a new high. And now the banks/financials are struggling.
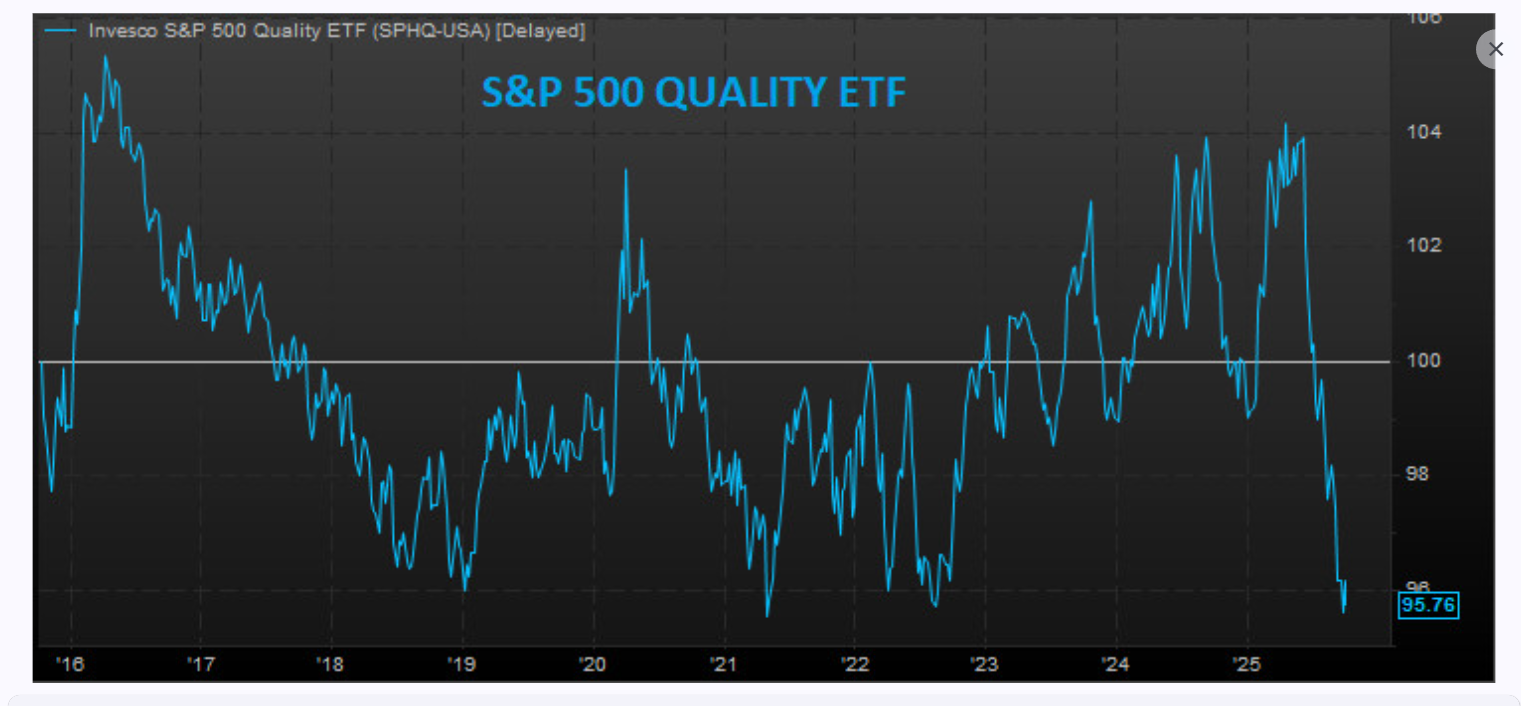
Most of what we’ve seen in the recent rally is low quality. Here is a chart of the S&P Quality ETF relative to the S&P. That plunge in the past month or so tells you how far away from the quality stocks folks have gone — so much further out on the risk curve.
If that wasn’t enough, Liz Ann Sonders of Schwab provided us statistics from Bloomberg the other day on small caps. Using the Russell 2000, 57% of the index is currently profitable while 41% is unprofitable.
Since the April low the profitable part is up 22%. The unprofitable is up 53%. That is the "quality" issue the market has at present.
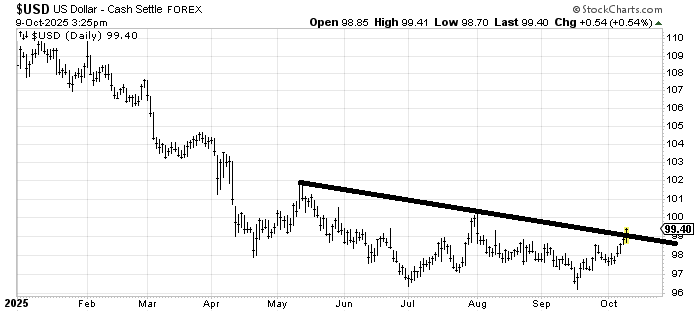
Then there is the rally in precious metals or just metals. It has gotten way out of hand, in my view. I have harped on it enough in the past few days, but suffice to say they are in need of pullbacks, especially since the US Dollar Index is peeking over that line I drew the other day.
On the sentiment front we had some extreme ISE call/put readings on Wednesday this week, as high as the final week of December. We’ve seen the Investors Intelligence bull/bear ratio move up to 3.75. It was 3.91 in December. Extreme is in that 4.0 area.
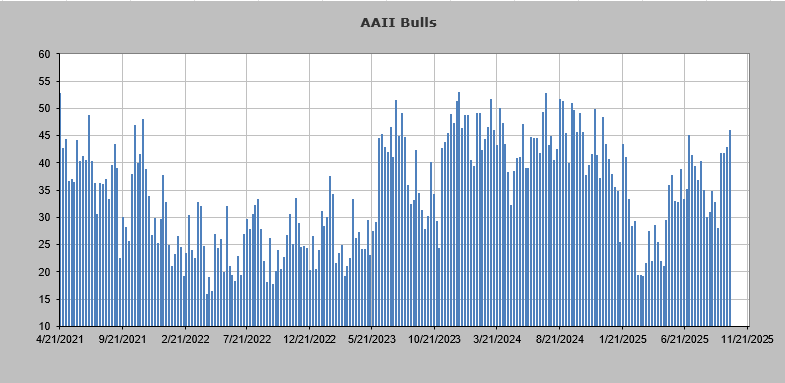
On Thursday we saw the AAII folks join the bull parade. Oh, don’t worry, they have not thrown caution to the wind. But the bulls are higher than they were in early July, which is the highest since just after the election.
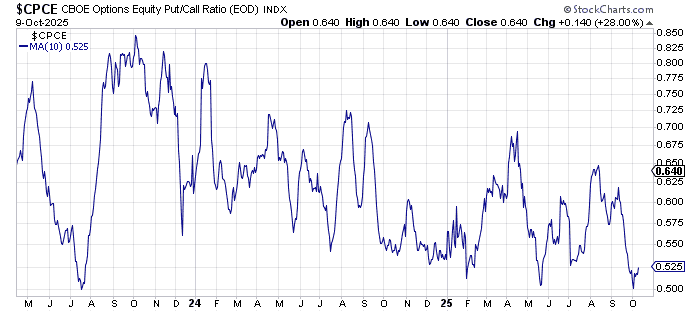
The 10-day moving average of the equity put/call ratio has managed to get to .50 and is now rising again. It doesn’t get down here very often, but when it does it usually means a correction is in the offing — yes, even May saw a pullback.
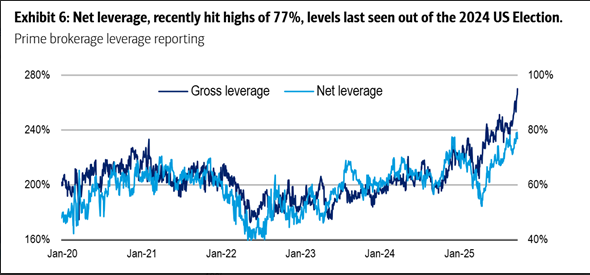
We know the Citi Panic/Euphoria Model is in Euphoria. We know the Insiders have been selling. In terms of exposure the NAAIM folks are not overexposed, as they stand at 84. But when to comes to hedge funds, let’s not use gross leverage since that looks very extreme. Let’s use net leverage and we can see that is now where it was right after the election, according to Bank of America. In other words, these folks are mostly all in.
We have seen plenty of stocks take it on the chin lately: the restaurants, some asset managers and now the homebuilders. I have called it group rotation because as you might have noticed Thursday, they finally rotated back into names like Meta and Amazon. The market as a whole ought to correct but until we see that occur, this rotation, which is getting narrower and more speculative, is worth paying close attention to.