Is the Fear Enough to Turn the Tide?
Let's examine the contrarian market sentiment indicators.
You've reached your free article limit
You've read 0 of 1 free Pro articles.
The markets continue to see notable declines Monday, so let's take a look at the overall technical picture.
Is the correction close to finished or are we due for more pain and volatility?
Indexes Break Support as Correction Continues
On the charts, all the major equity indexes closed lower Friday with broadly negative internals.
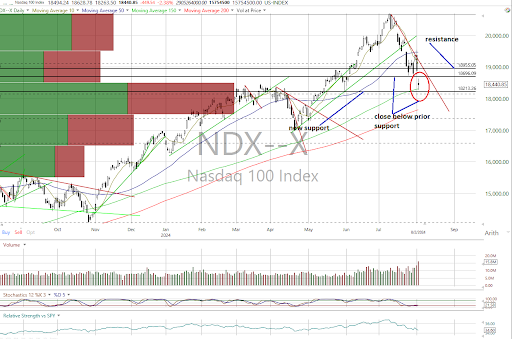
Negative technical events occurred with all closing below their respective support levels while the DJIA and Dow Jones Transports turned neutral from bullish as they closed below their uptrend lines.
Also, the MidCap 400 broke below its 50-day moving average and is now neutral as well.
The near-term trends are bearish on the S&P 500, Nasdaq Composite, Nasdaq 100 (see below) and Russell 2000.
Cumulative market breadth also suffered with the All Exchange and Nasdaq bearish and the NYSE neutral.
No stochastic signals of import were generated.
McClellan 1-Day OB/OS Oscillators Mostly Neutral
The data, in our opinion, is still sending warning signals.
The 1-Day McClellan Overbought/Oversold Oscillators are still mostly neutral and do not suggest an oversold bounce (All Exchange: -46.89 NYSE: -28.6 Nasdaq: -58.89).
The percentage of S&P 500 issues trading above their 50-day moving averages (contrarian indicator) dropped to 55% and is also neutral.
The detrended Rydex Ratio (contrarian indicator), however, dipped to a neutral 0.95 but lacks high fear levels associated with bottoms.
Last week’s AAII Bear/Bull Ratio (contrarian indicator) stayed bearish at 0.53, and the Investors Intelligence Bear/Bull Ratio (contrary indicator) also stayed bearish at 23.2% as bulls continued to outweigh bears by a wide margin. There is no “wall of worry” to climb on their part.
Importantly, the Open Insider Buy/Sell Ratio remains bearish at 24.8 as insiders joined the crowd at the sell window.
Valuation Stays Stretched
The 12-month consensus earnings estimate for the S&P 500 from Bloomberg rose to $252.02 per share. However, that leaves its forward P/E multiple of 21.2x still well above the “rule of 20” ballpark fair value at 16.2x. We believe this premium remains significant.
The S&P's earnings yield rose to 4.71%.
The 10-Year Treasury yield dropped to 3.79% and below support. New support is 3.69% and resistance is at 3.98%. Its near-term trend is bearish.
The U.S. dollar, via the UUP ETF, closed lower and also below support at $28.57. Its trend is bearish with new support at $28.30 and resistance at $28.53.
Bottom Line
We have yet to see enough evidence that would suggest this correction has been completed.
We remain cautious until the weight of the evidence starts to suggest that a positive turn may be at hand.