Insiders Ramp Up Their Selling
This market indicator is now also flashing a red bear.
You've reached your free article limit
You've read 0 of 1 free Pro articles.
The major equity indexes had another tough session Friday as the charts saw further deterioration with several support levels being violated. Cumulative market breadth also weakened with all the advance/decline lines turning bearish.
On the data side, we aren’t seeing a great deal of encouragement, as insiders increased their selling (see below) while the detrended Rydex Ratio (contrarian indicator) finds the leveraged ETF traders still very leveraged long.
Three Indexes Break Support
On the charts, all the major equity indexes closed lower Friday with broadly negative internals on lighter trading volume with most closing near their session lows.
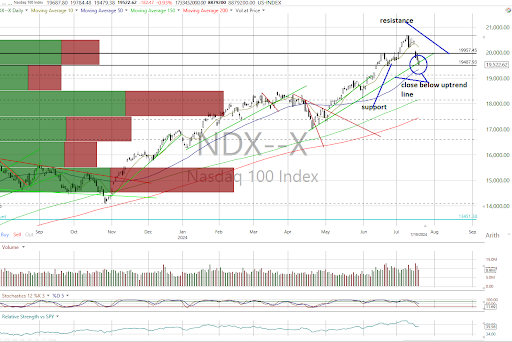
The weak session saw the Nasdaq Composite, Nasdaq 100 (see below) and MidCap 400 close below support that shifted their prior bullish trends to neutral as the rest are still in uptrends.
However, the market’s internal structure took another hit with the cumulative advance/decline lines for the All Exchange, NYSE and Nasdaq turning bearish from neutral.
Bearish stochastic crossover signals were also generated on the DJIA and Dow Jones Transports.
Insider Buy/Sell Ratio Turns Bearish
The data, in our opinion, has yet to send signals that the correction is done.
The 1-Day McClellan Overbought/Oversold Oscillators are still neutral despite the recent slide (All Exchange: +6.17 NYSE: +5.17 Nasdaq: +7.94).
The percentage of S&P 500 issues trading above their 50-day moving average (contrarian indicator) slipped to 64% and is neutral.
Of import, the detrended Rydex Ratio (contrarian indicator) remains bearish at 1.23 as the leveraged ETF traders remain overexposed leveraged long. We still need to see some fear on their part.
Thus, two of the three sentiment indicators are bearish with last week’s AAII Bear/Bull Ratio (contrarian indicator) unchanged at 0.59 and neutral, as the Investors Intelligence Bear/Bull Ratio (contrary indicator) stayed bearish at 16.9/63.1 as bulls continued to outweigh bears by a wide margin.
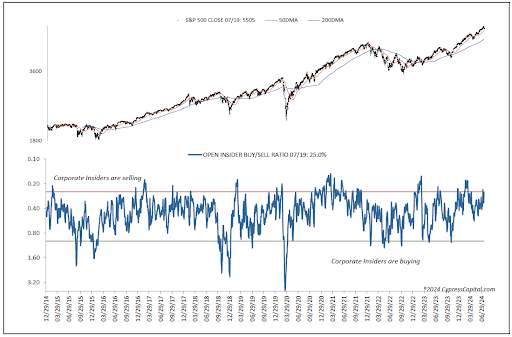
The Open Insider Buy/Sell Ratio (see below) is now also flashing red at 25.0 as insiders increased their selling activity.
Leveraged ETF sentiment is 13.8 and neutral.
Valuation Remains a Concern
The 12-month consensus earnings estimate for the S&P 500 from Bloomberg rose to $252.47 per share. But this still leaves its forward P/E multiple at 21.8x, well above the “rule of 20” ballpark fair value at 15.8x. Its 600-basis point premium remains significant.
The S&P's earnings yield is 4.59%.
The 10-Year Treasury yield rose to 4.24% and above resistance. Support is 4.17% and new resistance is at 4.27%. Its near-term trend is bearish.
The U.S. dollar, via the UUP ETF, closed higher at $28.82 and above resistance. Its trend is now neutral with support at $28.70 and new resistance at $28.87.
Bottom Line
We continue to see caution as the name of the game by honoring sell signals on individual names and being very selective on the buy side.