Extreme Greed on the Fear & Greed Index
Let's dive in and look at the stock market, options market, and bond market indicators.
You've reached your free article limit
You've read 0 of 1 free Pro articles.
How about a quick update on the Fear & Greed Index, now that it’s reading Extreme Greed?
What to watch for:
- Does Fear & Greed remain in the elevated zone or back off?
- Will Stock Price Strength and Breadth continue to roll over or turn upwards?
- If bonds rebound vs. stocks, will it be because stocks decline, bond prices rally, or a combination of the two?
- Same with Corporates. I would expect low-quality to underperform high-quality bonds as the relationship reverts towards the mean.
Notes:
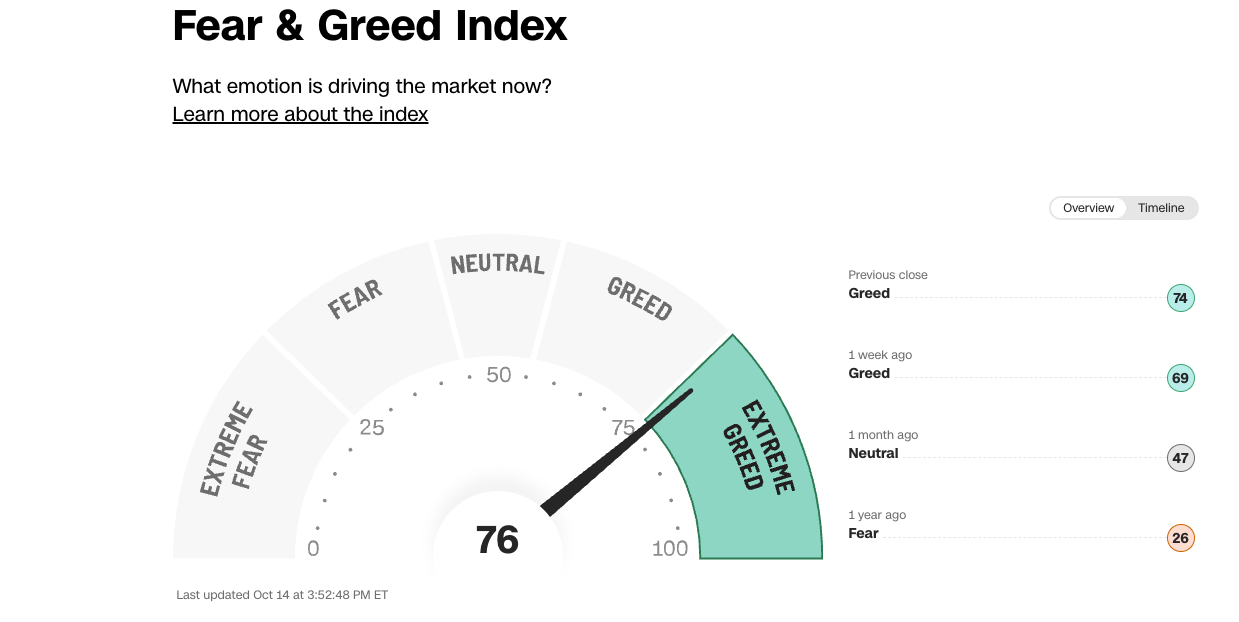
First of all, this is the highest reading since March, when Fear & Greed topped out at 79. Following that reading, the S&P 500 rallied for a few more weeks, before a 5% dip. At the time, I thought we’d get a little more, but stocks took off again at that point.
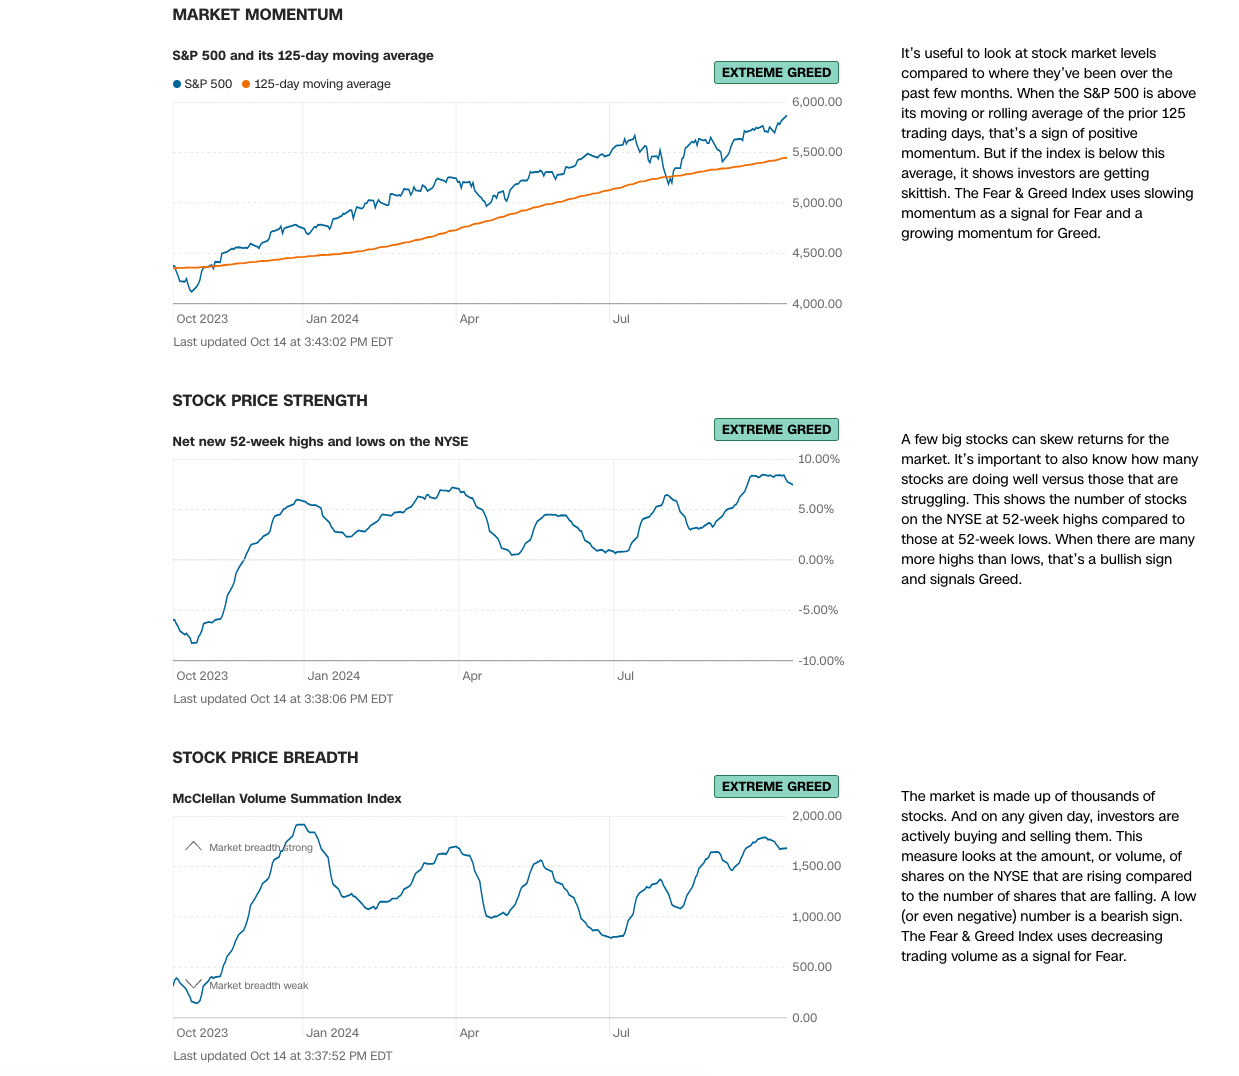
Stock Market Indicators
All three stock market indicators show Extreme Greed. As I’ve said before, this is not a bad thing! It shows that trend and breadth are both strong. Stocks are overbought, but it’s nice to see participation by more than just the Mag 7 stocks. Caveat: Both Stock Price Strength and Stock Price Breadth are rolling over. That indicates caution to me.
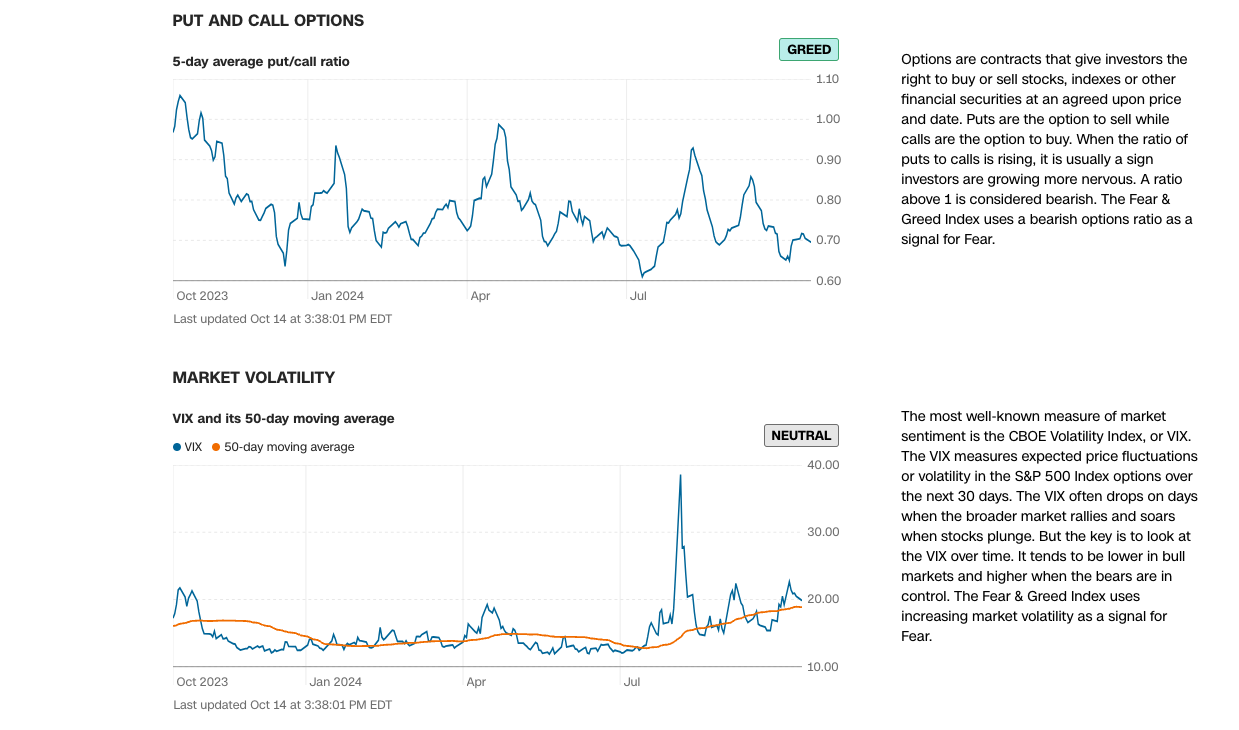
Options Indicators
Let’s start with the VIX. Neutral just means that it’s excluded. But, even though it’s not part of the Extreme Greed reading, doesn’t mean that we can’t look at it! And notice that it’s continuing the series of rising highs and lows we talked about two weeks ago. Somebody’s worried.
Put and Call Options, the 5-day average put/call ratio shows greed, but, at 0.70, that’s a historically low level suggesting that bullish speculation is running rampant.
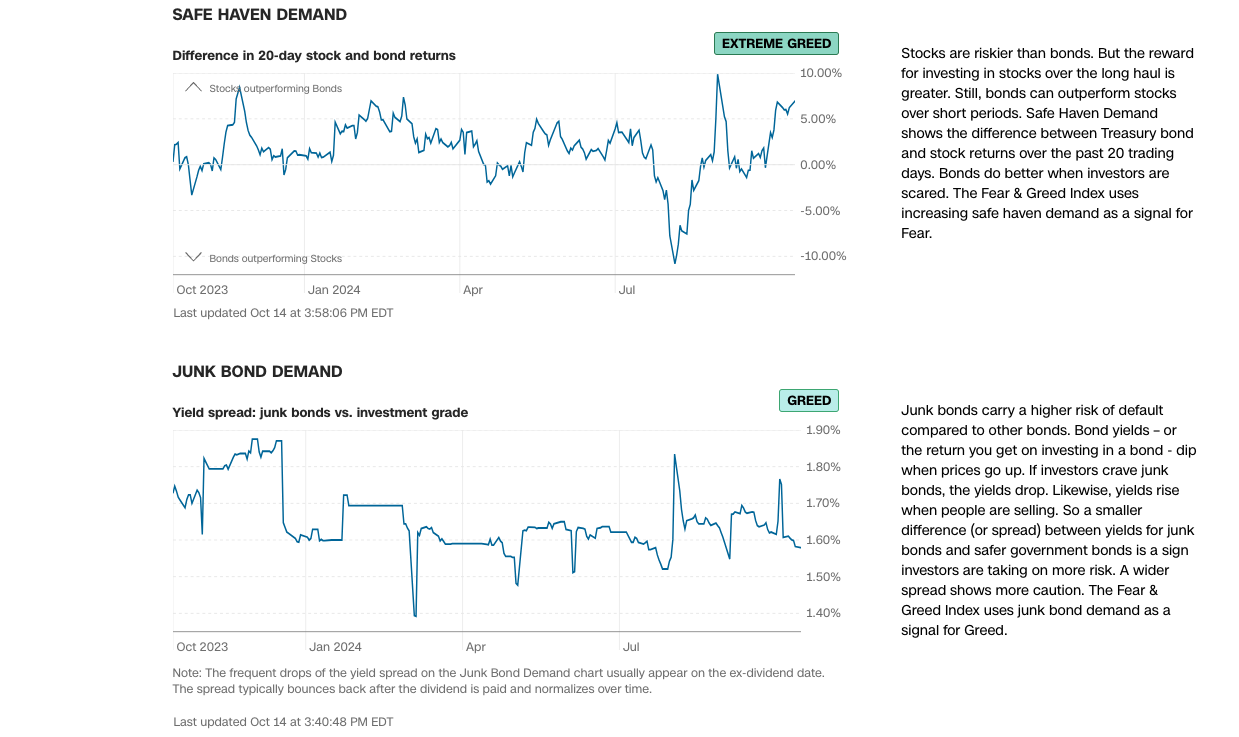
Bond Indicators
Both bond indicators are greedy. Safe Haven Demand shows stocks beating bonds over the last month by 7%. This is a higher than normal level that’s been driven by declines in bonds and a strong stock market. I’d expect mean reversion somewhere between here and the 10% level. Whether that will be stocks declining, bonds rebounding, or a combination, I have no idea.
Junk Bond Demand, or the yield spread between high- and low-quality corporates is just 1.58%. That’s a low level, which indicates greed but what’s even more interesting is that this drop was actually driven by greater selling in the high-quality bonds than the low-quality bonds.