Expect the Aftershocks to Follow This Earthquake
Let's look at the indicators to see whether investors are panicked yet.
You've reached your free article limit
You've read 0 of 1 free Pro articles.
Sometimes it is difficult to know where to begin after another sizeable down day in the market. Did we see any panic? Some. Mostly, I got the sense folks were still a bit complacent, though.
For example, there was panic in that move in the VIX to 65. There was panic in that over 90% of the volume was on the downside. And even the QQQs saw volume rise up to levels not seen since March 2023, when SIVB blew up.
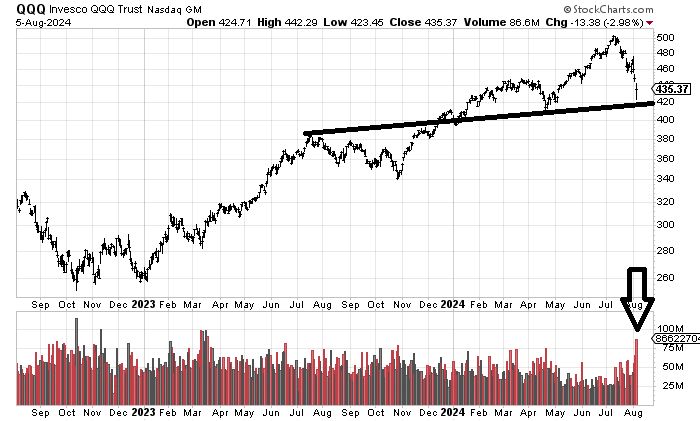
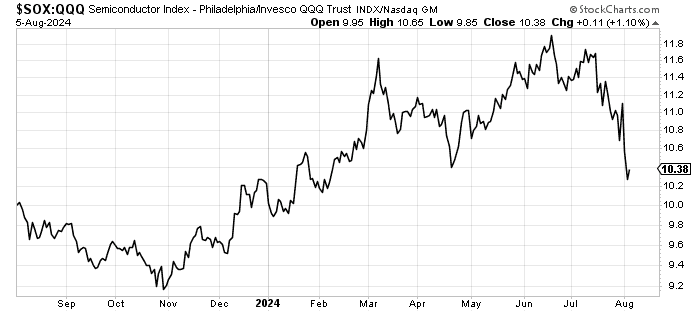
And while it has nothing to do with panic, I would like you to haul out your magnifying glass to notice that the SOX outperformed the QQQs on Monday.
While not in the panic category, we did see the put/call ratio at 1.29, showing some decent put buying. We also saw the ISE call/put ratio sink under 1.0, to the lowest level since early May.
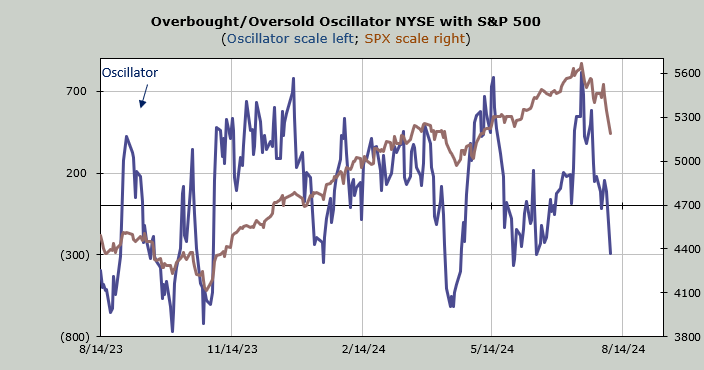
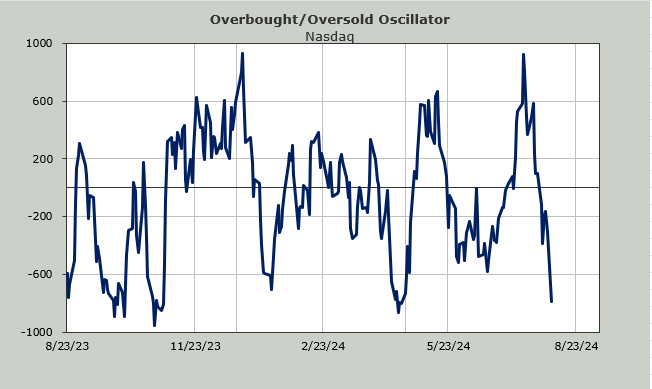
In terms of momentum, the NYSE Oscillator finally dipped under the zero line. While I know it appears oversold, I still view it as just a bit oversold. Nasdaq’s Oscillator is similarly a bit oversold.
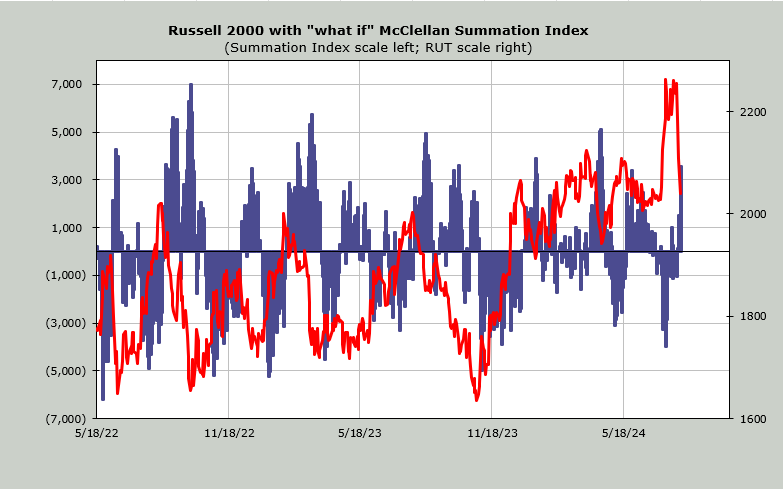
However, if we use the what if for the McClellan Summation Index, things look a bit different. We already know that both Nasdaq’s and the NYSE have their Summation Indexes heading down. As of today the NYSE’s needs +3600 advancers minus decliners on the NYSE to halt the decline. When it gets over +4000 I consider it extreme. Thus this is ‘oversold’. It was higher in April (got to +5000)
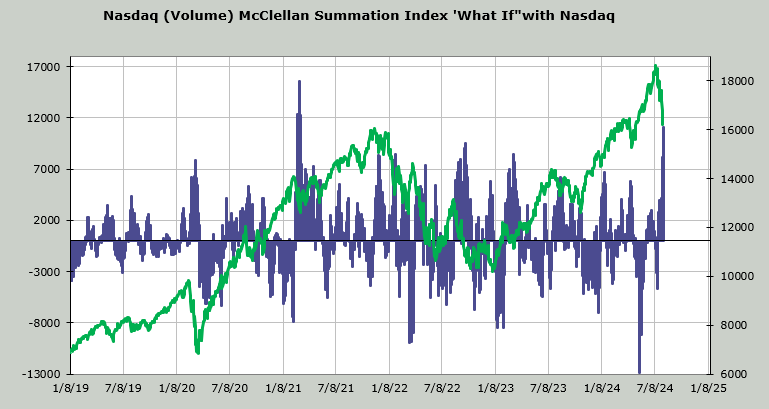
Over in Nasdaq land it’s a bit more extreme. Here I use volume (up/down) instead of advancers and decliners. This indicator currently needs a net differential of +12 billion shares to halt the decline. Stop and think about that a minute. Nasdaq has traded about six billion shares for the last four days so to get it to stop going down we would need to see 90% of the volume on the upside for at least two consecutive days. That’s how we know this is extreme now. It is the most since March of 2021. It’s hard to see on the chart but we did rally and come back down in 2021.
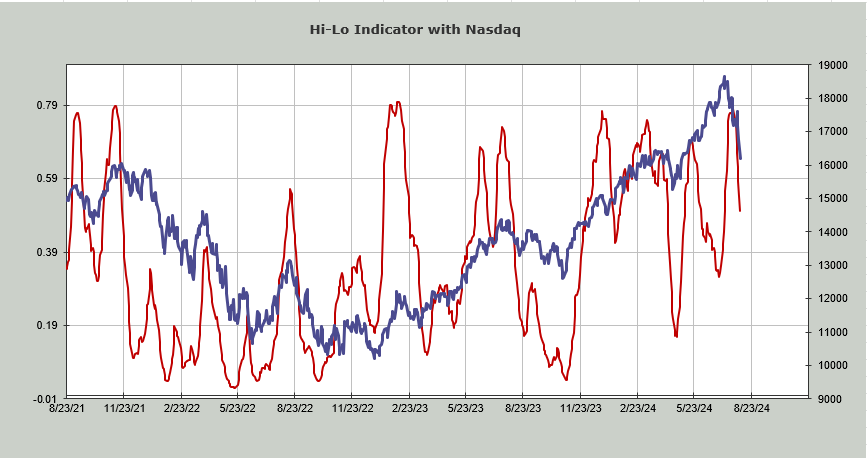
Let me remind you that the intermediate-term indicators are not oversold. The easiest example I have is the Nasdaq Hi-Lo Indicator is at .50. That’s not even where it got in June or April.
Finally let me get back to the bonds. They didn’t do much on Monday. The Daily Sentiment Indicator (DSI) is still 86 which I still think is high enough to believe the move in the bonds is close to done.
Since the Yen is getting so much chatter regarding the carry trade, let me report the DSI for the yen is 87 and the DSI for the US Dollar is 15. These too say the move is getting stretched. Certainly if we got another day or two of this those readings should get extreme.
Finally, the DSI for the S&P is at 26 while Nasdaq is at 34. Not extreme.
We had an earthquake in the market. Earthquakes tend to come with aftershocks. So once we get the short-term oversold rally we should come back down as the aftershocks take hold.
