Clouds Remain Overhead on the Charts So Expect More Chop
We got some negative technical events, though the overall data still appear neutral.
You've reached your free article limit
You've read 0 of 1 free Pro articles.
Several negative technical signals came in on Thursday, as the overall data still look neutral.
The quick and dirty: We can expect more sideways chop ahead.
Let's look under the hood:
Charts and Technicals
All index charts closed near their session midpoints, which resulted in several negative technical events:
- The S&P 500, Dow Jones, Dow Jones Transports, the mid-caps and the small-cap Russell 2000 closed below support, while the Dow Transports closed below its 50-day moving average and the Russell 2000 trend shifted from neutral to bearish.
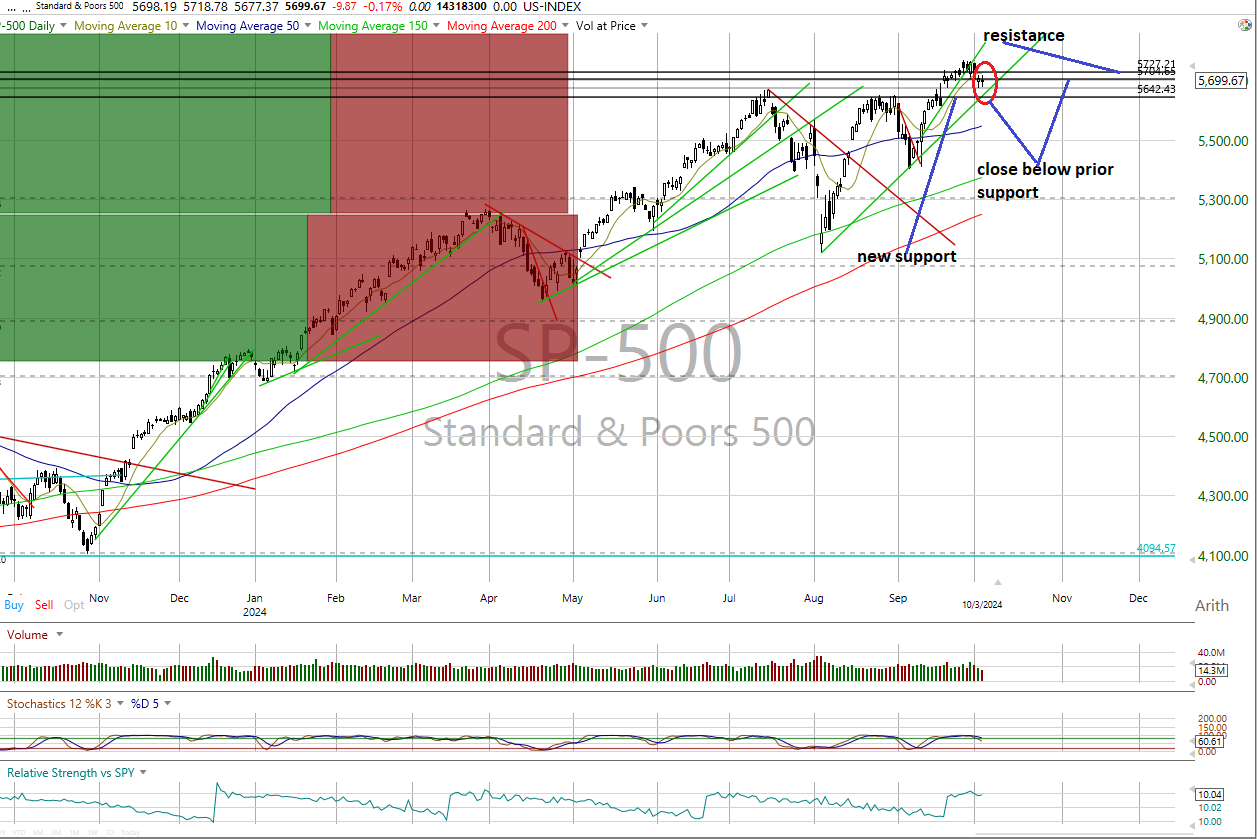
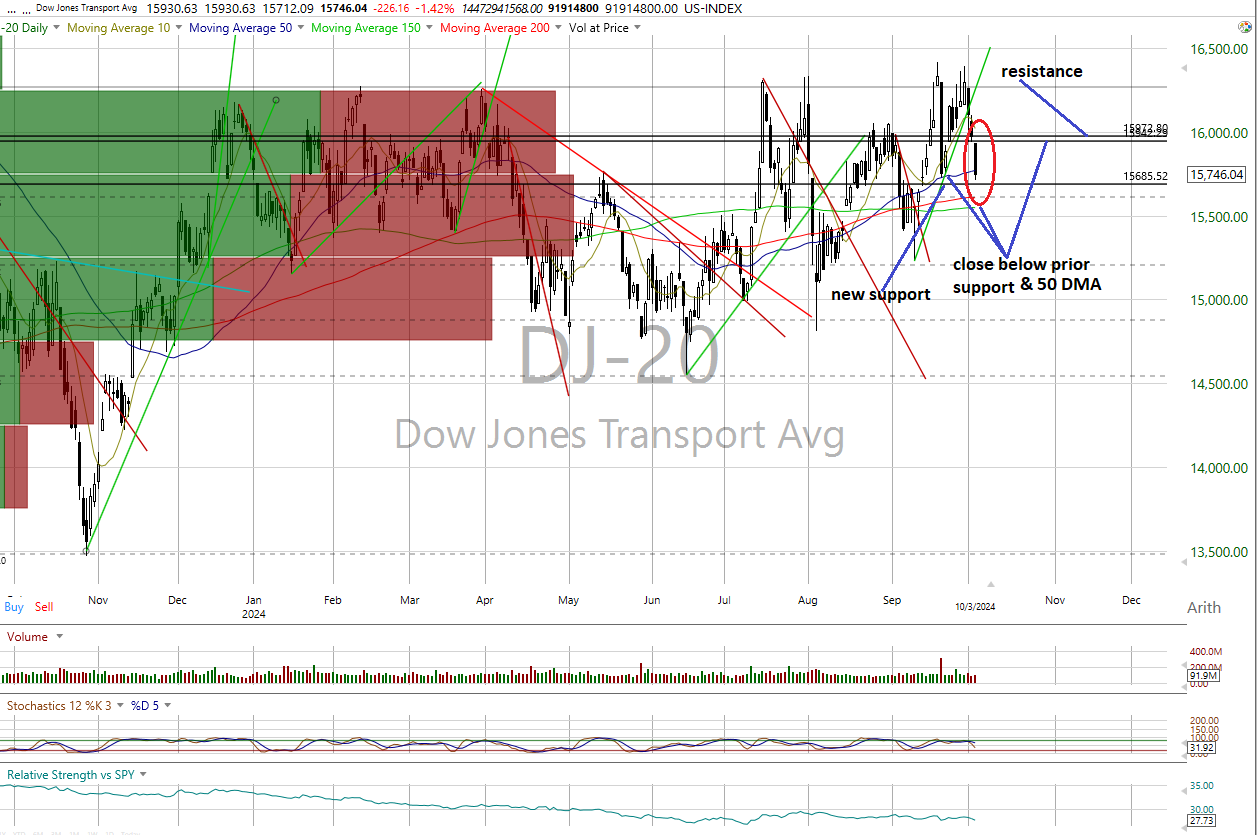
- Only the Dow Jones is in a bullish trend with the rest neutral.
- Cumulative market breadth also weakened with the advance/decline lines for the All Exchange and Nasdaq turning bearish as the New York Stock Exchange's stayed neutral.
- The stochastic levels are mostly neutral, but the Russell's is oversold yet has not generated a bullish crossover signal so far.
The data is still largely neutral.
- The one-day McClellan overbought/oversold oscillators are neutral, except for the NYSE that is mildly oversold (All Exchange: -43.54; NYSE: -50.18; Nasdaq: -40.79).
- The percentage of S&P 500 issues trading above their 50-day moving averages -- a contrarian indicator -- slipped to 72% and is neutral after its previous warning signal early this week of 83% that, once again, demonstrated its prescience.
- Another contrarian indicator, the detrended Rydex Ratio, is unchanged to 0.96 and still neutral.
- The Open Insider Buy/Sell Ratio dipped to 46.1 and is also neutral, but saw buyers earlier in the week.
- This week’s American Association of Individual Investors Bear/Bull Ratio, a contrarian indicator, dipped to a neutral 0.58, but the number of bears declined.
- The Investors Intelligence Bear/Bull Ratio, which is also a contrarian indicator, remains neutral at 22.6/52.5, but the number of bulls rose.
- Finally, valuation does remain a concern. The 12-month consensus earnings estimate for the S&P 500 from Bloomberg dropped to $256.32, leaving its forward price-to-earnings at 22.2 still well above the “rule of 20” ballpark fair value at 16.2. We believe this premium still presents some risk.
- Its earnings yield is 4.5%.
The Buck and Treasuries
The 10-year Treasury yield rose to 3.85% and above resistance. Support is 3.78% and new resistance at 3.86%. Its near-term trend is bullish.
The U.S. Dollar, via Dollar Index Bullish Fund UUP closed higher at $28.51 and above resistance. Its trend is bullish with support at $28.34 and new resistance at $28.52.
The Bottom Line
Clouds are still overhead as the chop continues.