Charts and Data Suggest Approaching This Market With Caution
Late session rally leaves data mostly neutral as valuation remains extended.
You've reached your free article limit
You've read 0 of 1 free Pro articles.
Due to Friday's late rally all the major equity indexes closed near their session highs with positive NYSE and Nasdaq internals. There was some improvement on the charts as two shifted to neutral from their prior bearish trends while cumulative market breath also saw some improvement. However, we still find the near-term trends mixed while cumulative breadth leaves something to be desired.
And while the data is largely neutral, an excess of bullish sentiment on the part of investors combined with what we see as an extended forward valuation for the S&P 500, suggest the equity markets should be approached with some degree of caution.
Equity Index Trends Remain Mixed
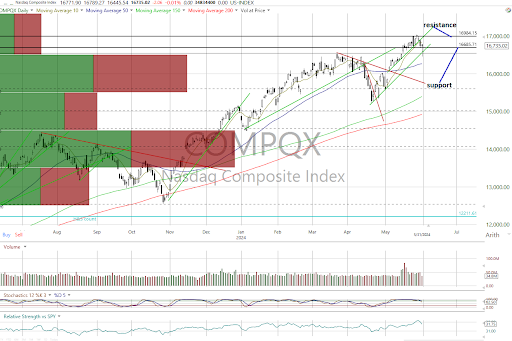
On the charts, all the major equity indexes closed higher on Friday as the last 20 minutes of the session saw buyers come in to save the day that had been quite weak going into the close.
Internals were positive as the indexes closed near their session highs that moved the DJIA, Midcap 400 and Value Line Arithmetic Index above resistance as the Dow Jones Transports and Russell 2000 turned neutral from bearish.
Only the Nasdaq Composite and Nasdaq 100 are in uptrends with the DJIA, MidCap 400 and Value Lie index bearish.
The S&P 500 chart remains neutral.
Cumulative breadth saw some improvement as the advance/decline lines for the All Exchange and NYSE moved to neutral from bearish. However, the Nasdaq A/D is still bearish.
Bullish stochastic crossovers were registered on the Dow Transports and Midcap 400.
Late Session Rally Leaves Data Mostly Neutral
The data remain mixed.
The 1-Day McClellan Overbought/Oversold Oscillator are neutral (All Exchange: -10.7 NYSE: -5.63 Nasdaq: -14.47).
The percentage of S&P 500 issues trading above their 50-day moving averages (contrarian indicator) rose to 50% staying neutral.
Also of note, the detrended Rydex Ratio (contrarian indicator) remains on its warning signal as the typically wrong leveraged ETF traders maintained their leveraged long exposure at 1.12.
Last week’s AAII Bear/Bull Ratio (contrarian indicator) is unchanged at 0.66 and is neutral.
Yet the Investors Intelligence Bear/Bull Ratio (contrary indicator) was bearish at 17.7/56.5 as bulls outweigh bears.
The Open Insider Buy/Sell Ratio is neutral as it rose to 47.3.
Leveraged ETF sentiment is -9.2, remaining neutral.
Valuation Well Above Fair Value
The 12-month consensus earnings estimate for the S&P 500 from Bloomberg slipped to $252.93 per share. Its forward P/E multiple at 20.9x remains well above the “rule of 20” ballpark fair value of 15.5x. We reiterate that a 500-basis point premium remains a significant cause for concern.
The S&P's earnings yield is 4.79%.
The 10-Year Treasury yield dipped to 4.51%. Its trend is bullish with support at 4.5% and resistance at 4.65%.
The U.S. dollar, via the UUP ETF, closed lower at $28.66 and is neutral. Support is $28.49 and $29.08 is resistance.
Bottom Line
For the reasons noted above, we believe there is enough evidence to suggest maintaining our current near-term cautious outlook for equities as a whole. The market remains very selective.
We continue to honor sell signals on individual names while being extremely selective on the buy side.