Buyer Be ... Waiting
Here's why we suggest some patience on the buy side.
You've reached your free article limit
You've read 0 of 1 free Pro articles.
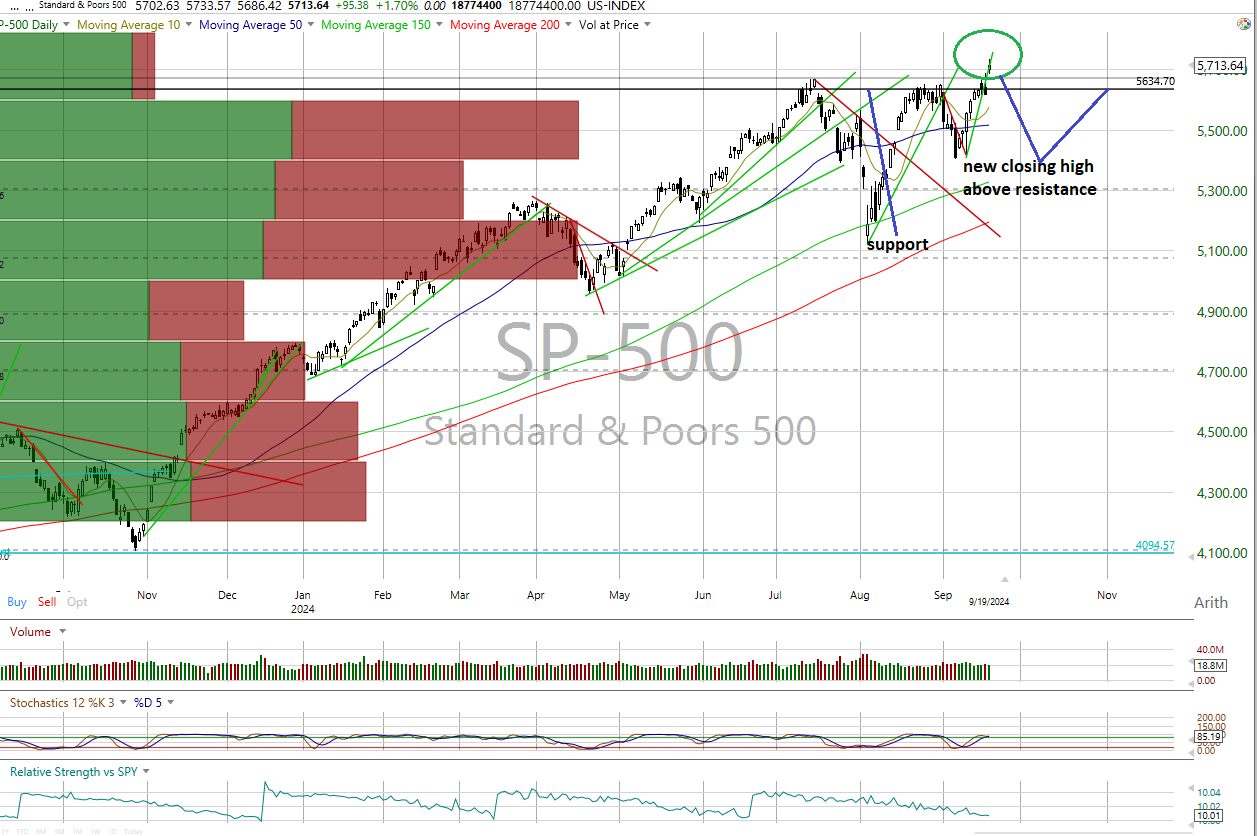
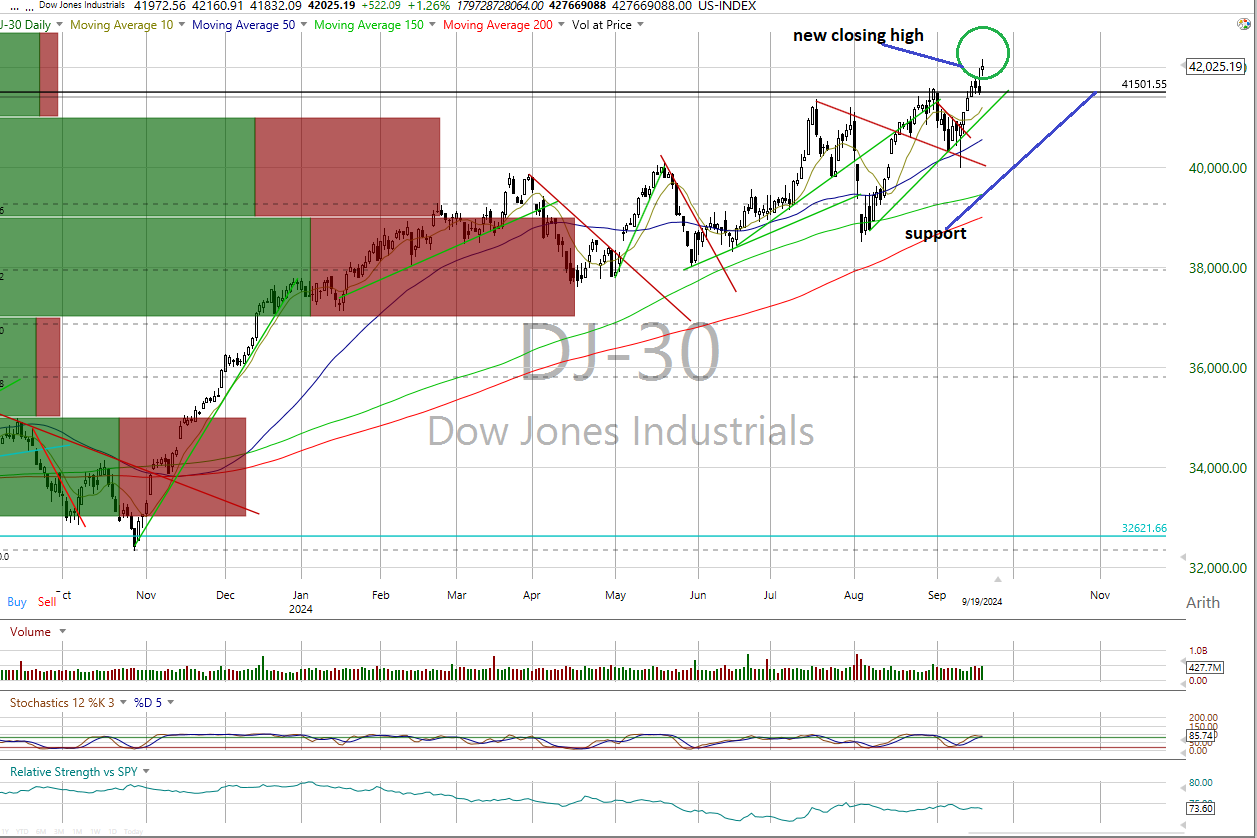
Three index charts have made new closing highs, and we can expect some consolidation ahead, so our advice: Wait for weakness.
Let me explain.
All the major equity indexes closed higher Thursday with positive New York Stock Exchange and Nasdaq internals, as trading volumes increased from the prior session. Most closed near the midpoint of their intraday ranges that resulted in a number of bullish technical events, including three new closing highs.
Also, cumulative breadth is supportive as it remains bullish. But the data suggests that patience is necessary on the buy side, given the McClellan one-day overbought/oversold levels, stochastics, the percentage of S&P 500 issues above their 50-day moving averages and valuation. We are waiting for some market weakness to adjust the data to become actionable.
The Charts and Technicals
On the charts, all the major equity indexes closed higher yesterday with bullish internals on heavier trade. The sizable gains resulted in the S&P, Dow Jones industrials and mid-caps making new closing highs, while the Nasdaq composite, Nasdaq 100 and Russell 2000 closed above resistance. As such, all the charts are in near-term bullish trends as are the cumulative advance/decline lines for the All Exchange, NYSE and Nasdaq. We would note, however, that the stochastic levels are all overbought but have not triggered bearish crossover signals thus far as they can remain overbought for extended periods.
The one-day McClellan overbought/oversold oscillators are all overbought (All Exchange: 66.05 NYSE: 80.57 Nasdaq: 59.61). Additionally, the percentage of S&P 500 issues trading above their 50 day-moving averages, a contrarian indicator, rose to 81% and is now bearish. This data point has been historically precinct as moves above 80% have been usually followed by market corrections of varying degrees.
The detrended Rydex Ratio, another contrarian indicator, is unchanged at 0.94 and is still just inside the neutral zone. The Open Insider Buy/Sell Ratio dropped to 27.4% but remains neutral.
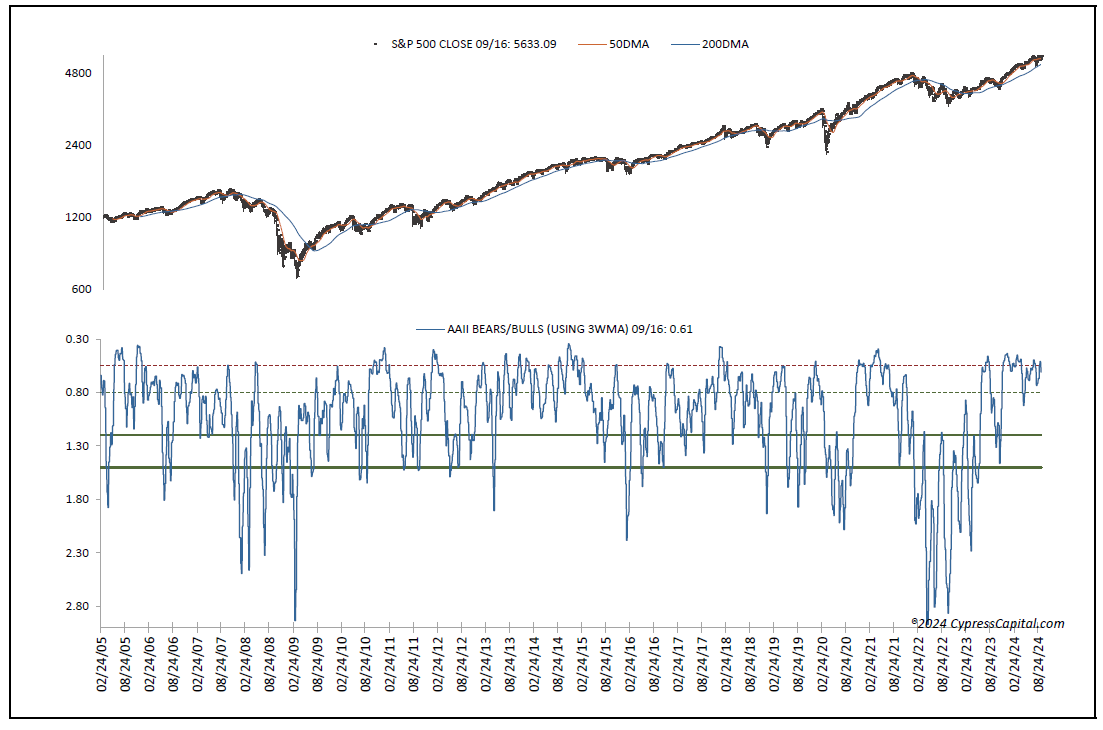
Also, this week’s American Association of Individual Investors Bear/Bull Ratio rose to 0.61 as the number of bears rose, staying neutral. The Investors Intelligence Bear/Bull Ratio remains neutral at 22.6/43.5 as the number of bulls declined by almost 10 points and also encouraging.
Finally, valuation does remain a concern. The 12-month consensus earnings estimate for the S&P from Bloomberg dipped to $257.38. That leaves its forward price-to-earnings at 22.2, and still well above the “rule of 20” ballpark fair value at 16.3. We believe this premium still presents some risk. Its earnings yield is 4.5%.
Treasury and Buck
The 10-year Treasury yield rose to 3.74%. Support is 3.57% and resistance at 3.79%. Its near-term trend is bearish. The U.S. Dollar, via the Dollar Index Bullish Fund UUP, closed lower at $28.09. Its trend is bearish with support at $28.06 and resistance at $28.22.
The Bottom Line
While we are generally bullish, the data is suggesting the best course of action is to wait for consolidation of the recent market surge that may afford better buying opportunities over the near term.