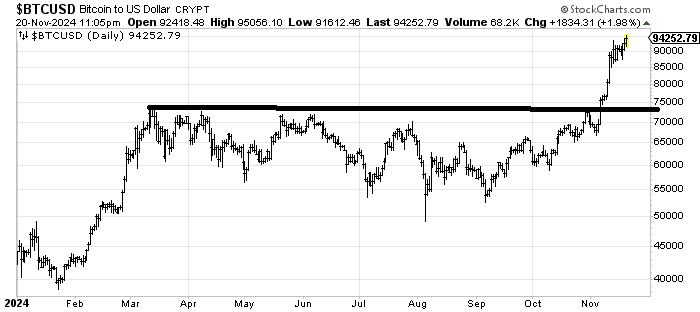
Bitcoin Has Gone Too Far
Speculation is up and lots of it has to do with Bitcoin. Let's check out that asset's Daily Sentiment Index.
You've reached your free article limit
You've read 0 of 1 free Pro articles.
I may as well get my speculation section out of the way first today!
The NYSE saw volume shrink to 3.8 billion shares on Tuesday, which is down about ten-percent from a week ago. Oh I know, we’re heading into the holiday. But if that is your excuse then why is Nasdaq volume running about two times what the NYSE’s volume is?
And since we know so much of the speculation has to do with Bitcoin, let me report that the Daily Sentiment Index (DSI) for Bitcoin is at 88. As a reminder, the DSI runs on a scale of zero to 100, although I have never seen it at zero or 100. Between 20 and 80 is neutral. Under 20 and over 80, it’s a yellow flag that something is getting extreme. Single digits and over 90 means we’ve gone too far and you really ought to take action. In this case, it would be selling Bitcoin.
The chart has done nothing wrong, but that base measures into the 95k area. I know everyone has a target at 100k because they like big round numbers, but if the DSI gets over 90, I’d take some profits for sure.
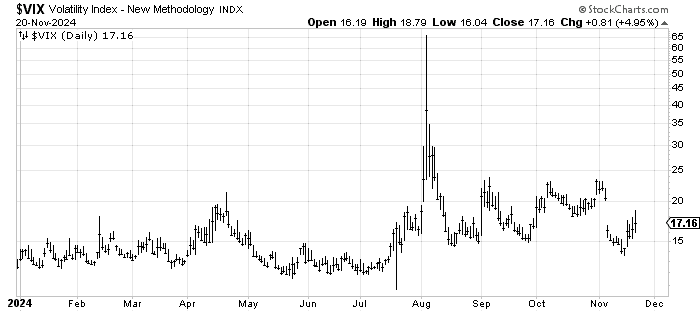
Away from that, the market has rallied a smidge this week, but the VIX has gone up every day as well. I am no VIX expert, but it does catch my eye when the S&P rallies and the VIX can’t fall.
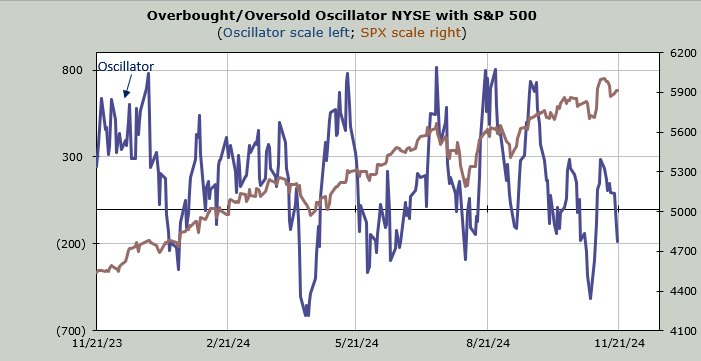
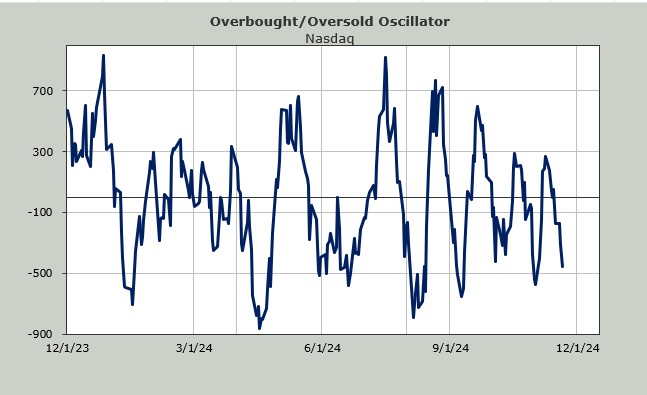
Breadth has not improved, as it has now been red six of the last seven trading days. That is another reason you see the Overbought/Oversold Oscillator continue to push down. It is getting closer to an oversold reading, though. I say you should want the market to go down and stay down the remainder of the week because that would set up an oversold rally for the holiday week.
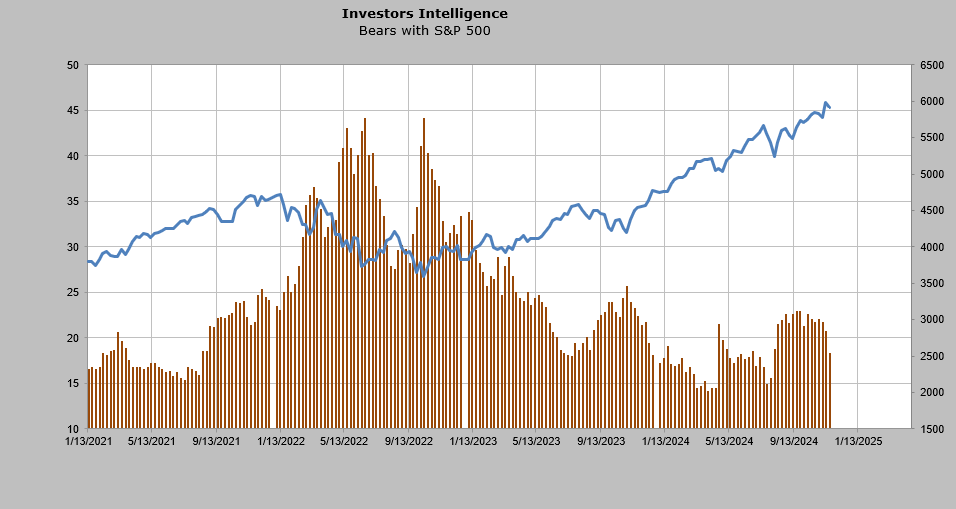
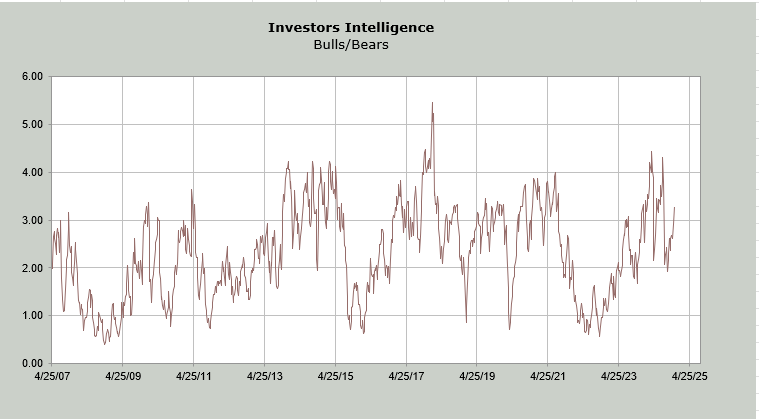
Sentiment wise, the Investors Intelligence bulls stayed the same at 60% but the bears notched down to 18.3%. This is their first teenage reading since last summer. In July the bears got to just under 15%. That reading of 15% bears coupled with the bulls over 60% took the bull/bear ratio over 4 (four bulls for every bear). It did that in April as well.
The current ratio is about 3.3 which means there are just over three bulls for every one bear so it is not extreme but heading that way.
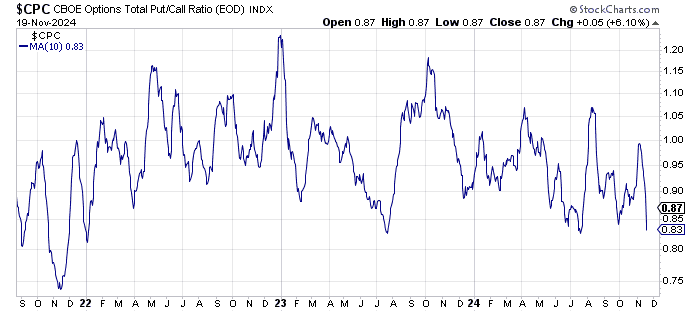
The ten-day moving average of the put/call ratio is at the low end of its three-year range. It was lower as we headed into the high in November 2021. Again, I do not think the market is in a similar situation to the last two elections. If we can ever get a proper oversold condition with some panic, we’d be in a much better situation. Otherwise I think we just keep this grind going until it just can’t do it anymore.