Bad Breadth, Yes, but Not That Bad Yet
Let's take a look at the indicators to see how bad breadth and sentiment are.
You've reached your free article limit
You've read 0 of 1 free Pro articles.
Soon we will hear from folks that there is nothing more bearish than an oversold market that doesn’t bounce. I would counter that we were only a little bit oversold. If we were at what I would term a proper oversold condition (see yesterday’s missive for a fuller explanation of this) and couldn’t bounce, then I would fuss a lot more.
That doesn’t mean the market’s action is bullish. It hasn’t been bullish for weeks. It just means it is too soon to say we were oversold and couldn’t bounce.
As I explained yesterday, my Oscillator is based on breadth, and breadth hasn’t been overwhelmingly negative. However since four of the last five trading days' breadth has been negative, there is a possibility if we have negative breadth readings for the next few days that, we would finally get to a good short-term oversold condition early next week.
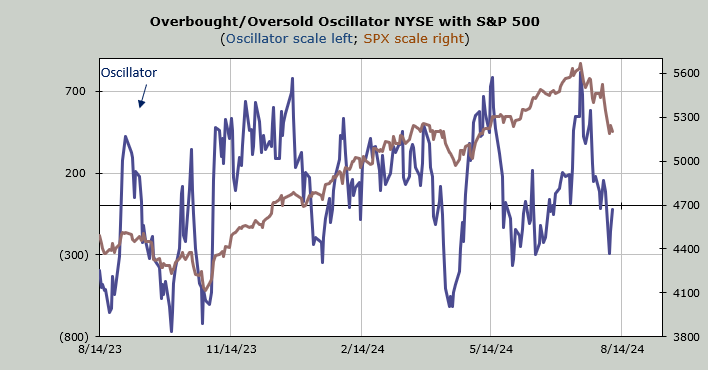
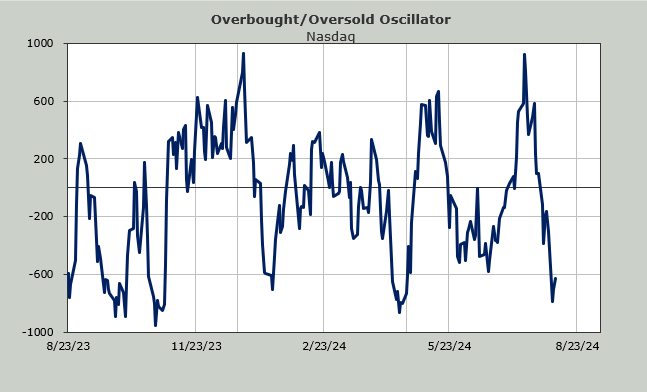
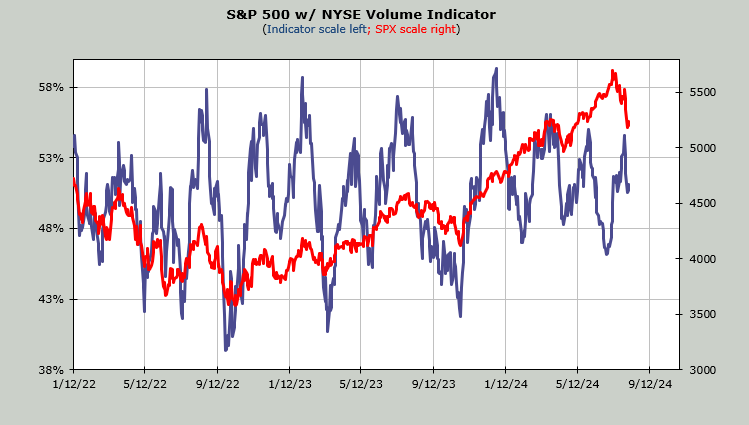
I would remind you that the intermediate-term indicators are not oversold, nor are they close to being oversold. For example, the Volume Indicator is at 51%. It will get oversold at 47% or less, and it doesn’t move quickly.
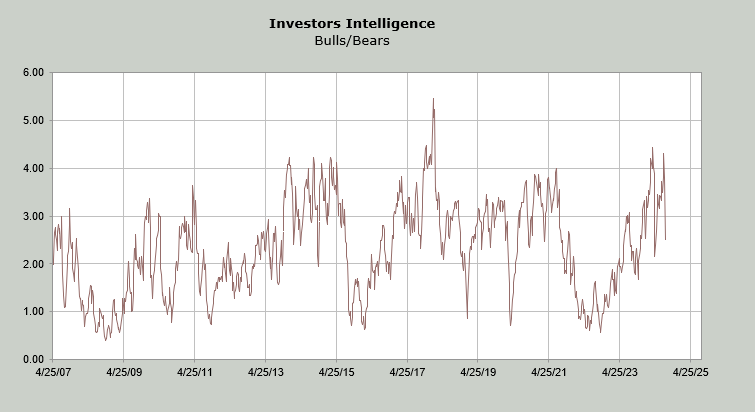
But let’s talk sentiment. The Investors Intelligence Bulls fell to 46.9% this week, which is a 13-point drop. In the last thirty years, the week-over-week change has only been a drop of ten or more four other times. We bounced all four times. Three of the four times, we bounced and came back down (my preferred scenario). Notice that the Bull/Bear ratio, which stretched over 4 a few weeks ago, is now around 2.5. It was lower in April and got under 2.0 in October of last year.
This means sentiment is finally shifting. It is not extreme, using this metric, yet but we’re finally seeing some movement.
The put/call ratios have also started to be persistently high. Just a few days ago I fussed because the ISE call/put ratio had slipped under 1.0 for the first time since early May. Wednesday’s reading was also sub-1.0. The 21-day moving average still has a way to go (shown here yesterday), but at least we’re finally getting some data that moves it.
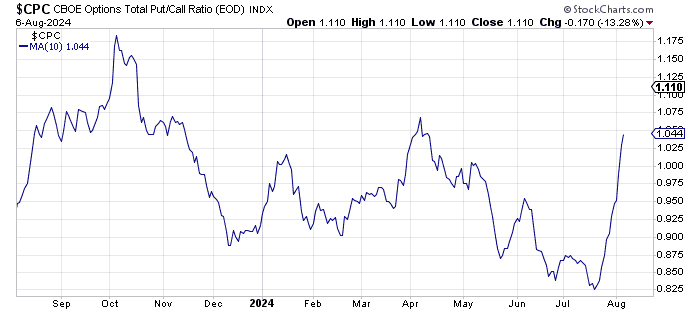
The CBOE’s put/call ratio has now been over 1.0 for four straight days, something we haven’t seen since April, when it had six consecutive days over 1.0. You can see the ten-day moving average has really rocked upward, a welcome change.
Let me finish by noting that the Daily Sentiment Indicator (DSI) for the S&P is at 29 and Nasdaq’s is 37, so they are still far away from any sort of extreme (under 15 is a flashing light, and single digits is extreme).
I suspect the AAII readings will show a vast change when released Thursday morning. Again, all these changes don’t tend to happen over the course of a week or two. They take time.
