After One Month of Churn, We Could All Use a 'Break'
Let's harp about the droopy Transports, the lack of a Nasdaq 'whack', and examine some food charts.
You've reached your free article limit
You've read 0 of 1 free Pro articles.
The Market
Not only was it another Either/Or Day, even the Haves of the Day mostly closed near their lows. And just in case anyone is keeping track, the Russell 2000 is flat on the year.
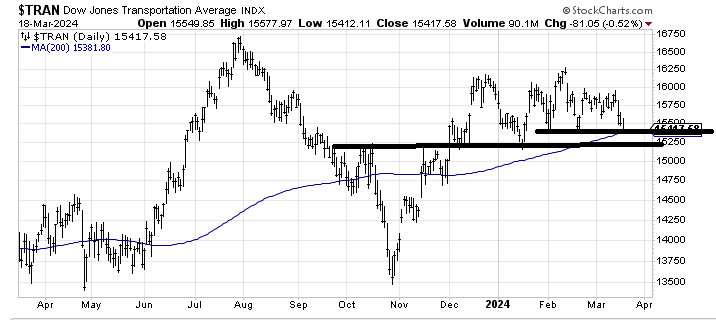
There are a few things to note. I’m going to start by harping about the Transports. Why? Not only are they down on the year, they are now sitting on their 200-day moving average. Recall last week I noted that 51,400 was a big support level followed by 15,200-ish.
The Transports have not been under their 200 DMA since November so if they break we might get some chatter on it. Somewhere between 15,200 and 15,400 I would expect a short-term oversold bounce but overall, this pattern is quite droopy.
Away from that, all the uptrend lines held so we continue to watch them. For the past few weeks the market has not managed to make any progress on the upside—the Nasdaq, and the QQQs are trading where they were in mid-February. That’s one month of churn. And that is why a break of the line matters: They are struggling to make new highs so a break could catch some momentum, to give us a whoosh.
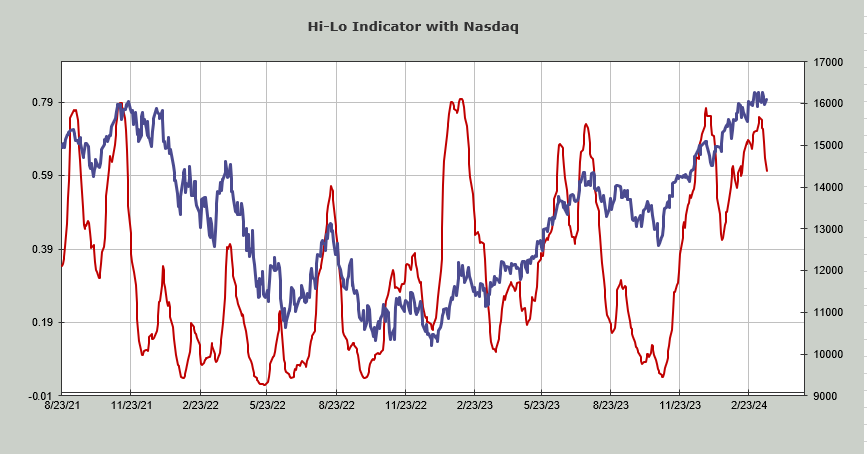
Notice that the Hi-Lo Indicator is now back at 0.60. At least when it rolled over in early January it did so with a few percent whack to the Nasdaq. So far that whack has been missing.
New Ideas
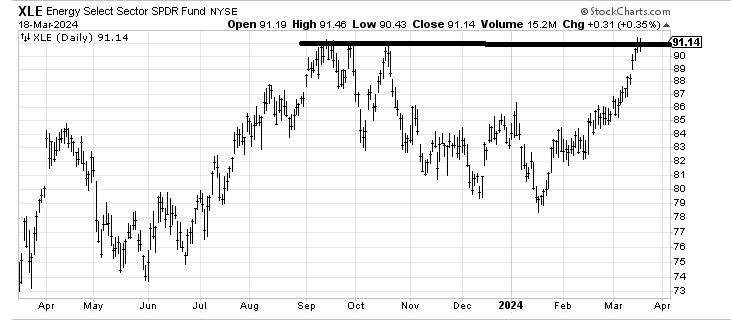
I am still an energy fan but the Energy Select Sector SPDR Fund XLE has been green for nine of the last 10 days. The DSI for oil is 80 so it’s starting to get "up there." A pullback would be nice. I would note that unlike last summer, I don’t get the sense that everyone is onboard the energy train. Not yet at least.
Today’s Indicator
The 30-day moving average of the A/D line will finally be overbought midweek this week.
Q&A/Reader’s Feedback
Helene welcomes your questions about Top Stocks and her charting strategy and techniques. Please send an email directly to Helene with your questions. However, please remember that TheStreet.com Top Stocks is not intended to provide personalized investment advice. Email Helene here.
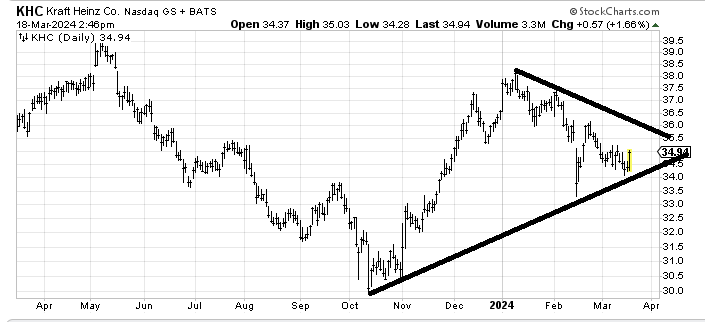
With the reversal in Hershey HSY today I was asked about the chart of Kraft Heinz KHC. It’s not bad for a trade. I’m just not sure it has done enough work to overcome the resistance that starts around $36.
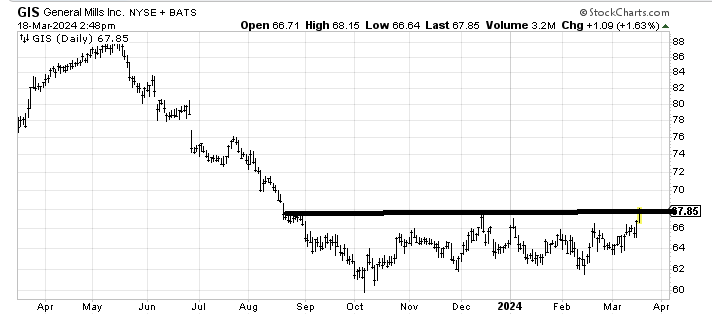
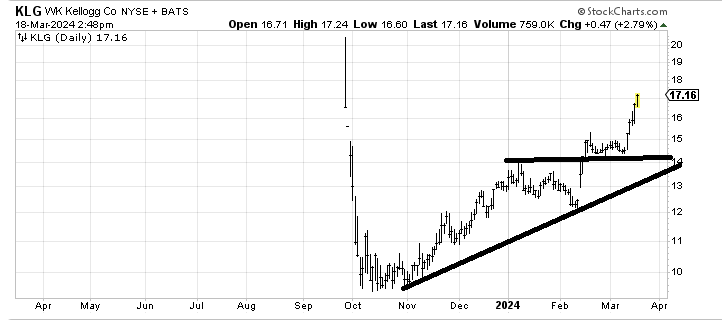
If you want a food chart with a base, then General Mills GIS has a base. Kellogg KLG, which I recommended back at $10-ish last fall, is a bit over-extended now but hasn’t done anything wrong yet, although I have a next target around $18 so I’d be inclined to sell a little there.
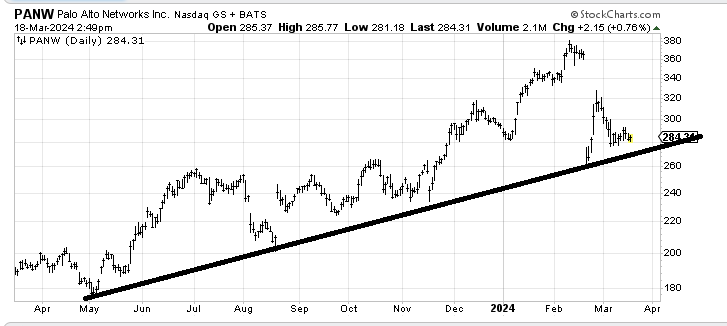
Palo Alto Networks PANW would be a good risk/reward around $270-275 because it would be close to that line, and if it breaks the line with any gusto then you know you are wrong.
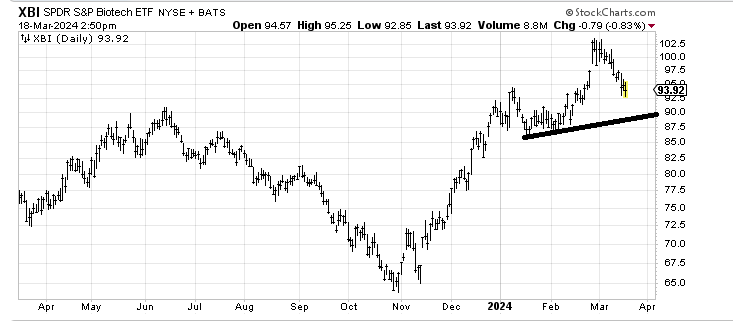
If SPDR S&P Biotech ETF XBI is going to be okay here I’d like to see it go sideways as it did in January and early February. It’s got support here, but I’m inclined to watch and see it develop before I'd venture in.