A Bounce Within a Correction?
Let's check the technicals and charts to see whether we can expect more bounce or if we're bounced out.
You've reached your free article limit
You've read 0 of 1 free Pro articles.
Is there more bounce to come?
Here's what the data says. The one-day McClellan overbought/oversold oscillators were oversold, however, they have reverted to neutral (All Exchange: -27.10; NYSE: -11.45; Nasdaq: -37.6). That suggests the lion’s share of the bounce has already occurred. Also, remember valuations are still extended.
Let's dig deeper into the technicals and charts ...
On the Charts:
- All closed near their session highs that saw the Nasdaq composite index, Nasdaq 100, Dow Jones Transports and the mid-caps all closed above resistance.
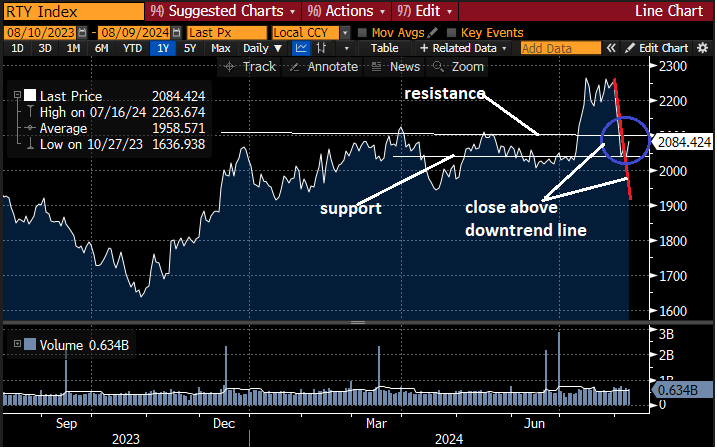
- Also, the mid-caps and the small-cap Russell 2000 closed above their downtrend lines and are neutral, while the rest are still in near-term bearish trends.
- Cumulative market breadth also improved as the advance/decline lines for the All Exchange, New York Stock Exchange and Nasdaq turned neutral from bearish.
- Bullish stochastic crossover signals were generated on the S&P 500 and Dow Jones.
The Technicals
- The percent of S&P issues trading above their 50-day moving averages, which is a contrarian indicator, rose to 54% and is neutral.
- The detrended Rydex Ratio, another contrarian indicator, dropped to 0.56 and neutral, but is lacking high fear levels.
- This week’s American Association of Individual Investors Bear/Bull Ratio, again, a contrarian indicator, moved to neutral from bearish at 0.57 as the Investors Intelligence Bear/Bull Ratio stayed bearish at 25.85% as bulls continued to outweigh bears by a wide margin. We continue to believe the “wall of worry” still needs to be rebuilt.
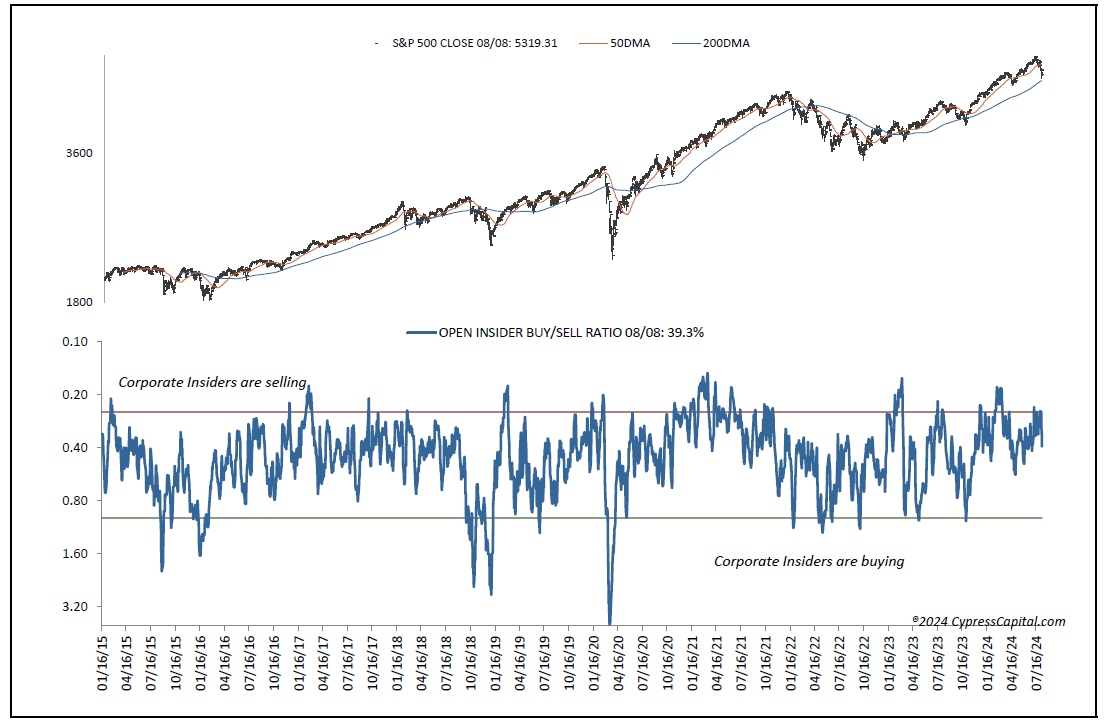
- The Open Insider Buy/Sell Ratio (rose to a neutral 54.0% as insiders did some buying.
Buck, Valuation
Finally, valuation remains a concern. The 12-month consensus earnings estimate for the S&P from Bloomberg rose to $250.75. That leaves its forward price-to-earnings of 21.2 still well above the “rule of 20” ballpark fair value at 16.0. We believe this premium remains significant. Its earnings yield dropped to 4.71.
Also, the 10-year Treasury yield rose to 4.0% and above resistance. Support is 3.79% and new resistance at 4.09%. Its near-term trend is bearish. The U.S. Dollar, via the Dollar Index Bullish Fund UUP, closed higher at $28.60. Its trend is bearish with support at $28.30 and resistance at $28.60.
The Bottom Line
In conclusion, while the markets have recently seen some relief, we are not convinced the relief is more than an oversold bounce within an ongoing correction.