Roku Takes a Tumble as Its Outlook Disappoints
Roku's charts were choppy before the company revealed that it expects a larger first-quarter loss than investors anticipated.
You've reached your free article limit
You've read 0 of 1 free Pro articles.
Roku Inc. ROKU shares are gapping lower here on Friday as its expectation of a bigger first-quarter loss than analysts have been forecasting disappointed investors Let's check out the charts and indicators of the streaming platform operator to see what may be ahead for the stock of Roku, which I last reviewed on Dec. 14.
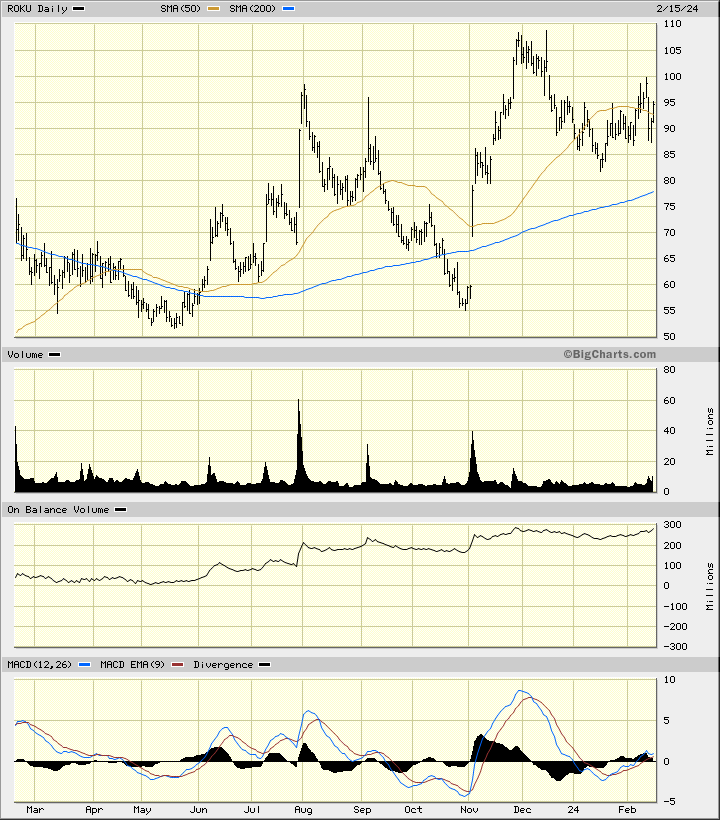
In this daily bar chart of ROKU, below, I can see that prices moved in a choppy sideways pattern the past month or so. Prices are indicated to open around $78, which would put them clearly below the declining 50-day moving average line but still above the rising 200-day moving average line. The On-Balance-Volume (OBV) line shows a rise from March but has moved sideways since early December. The Moving Average Convergence Divergence (MACD) oscillator recently edges above the zero line.
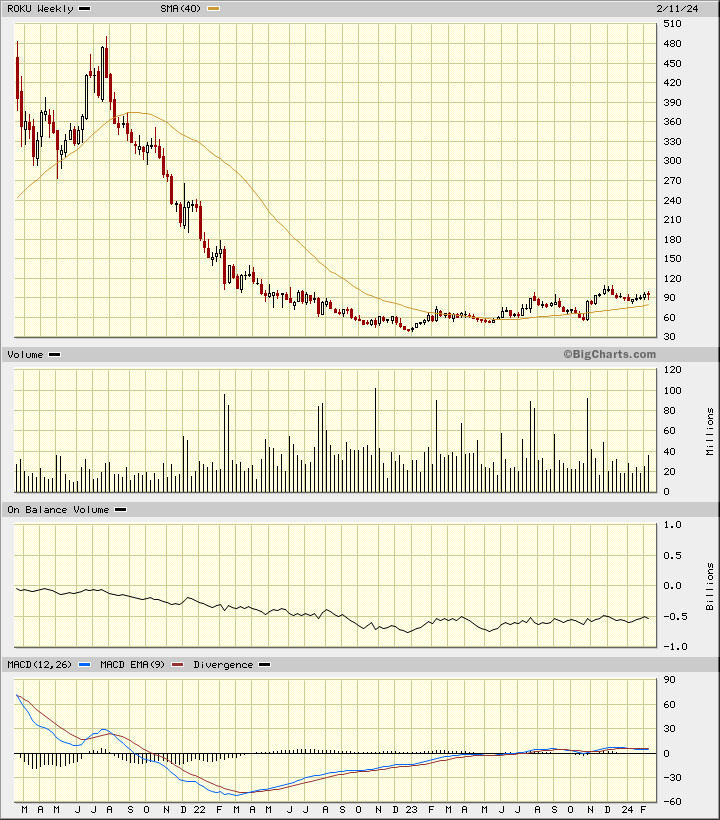
In this weekly Japanese candlestick chart of ROKU, below, I see a neutral picture. Prices are above the rising 40-week moving average line but it could get tested in the days ahead. The weekly OBV has been neutral for the past year. The MACD oscillator is above the zero line but correcting.
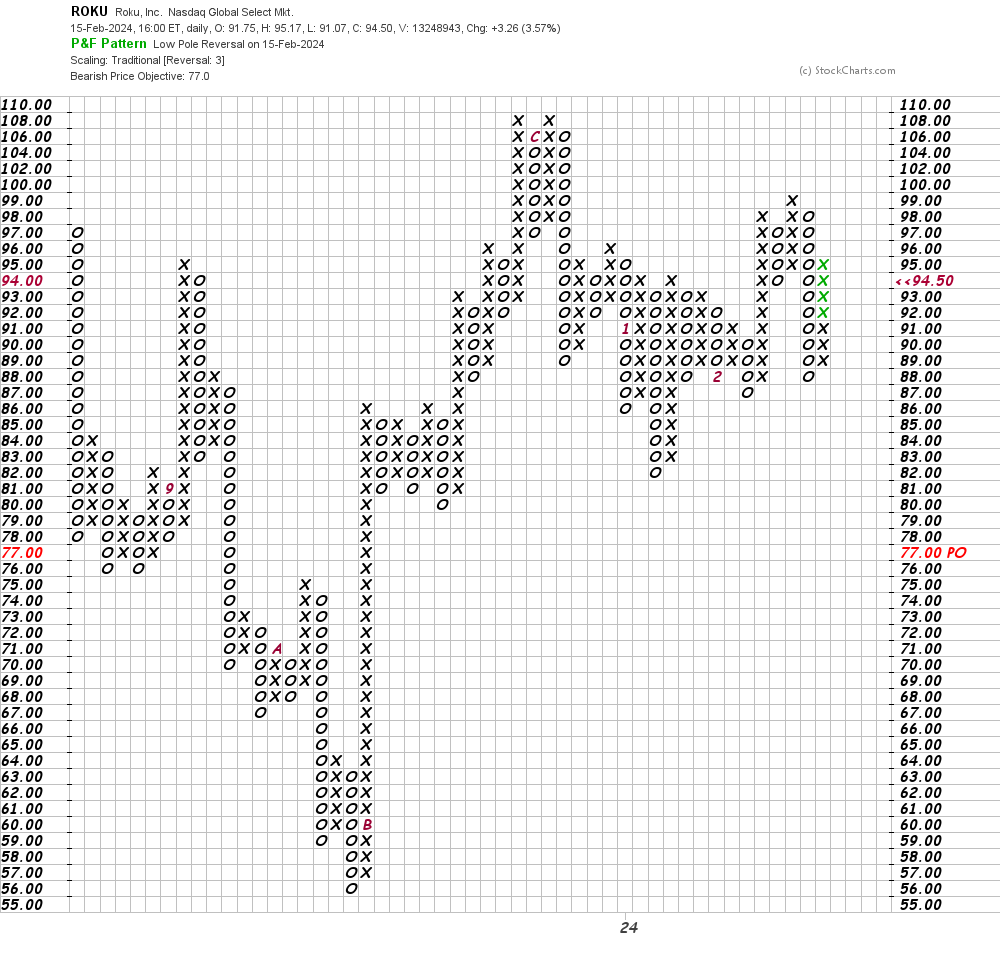
In this daily Point and Figure chart of ROKU, below, we don't have today's pre-market decline plotted yet but the chart already shows us a downside price target in the $77 area.
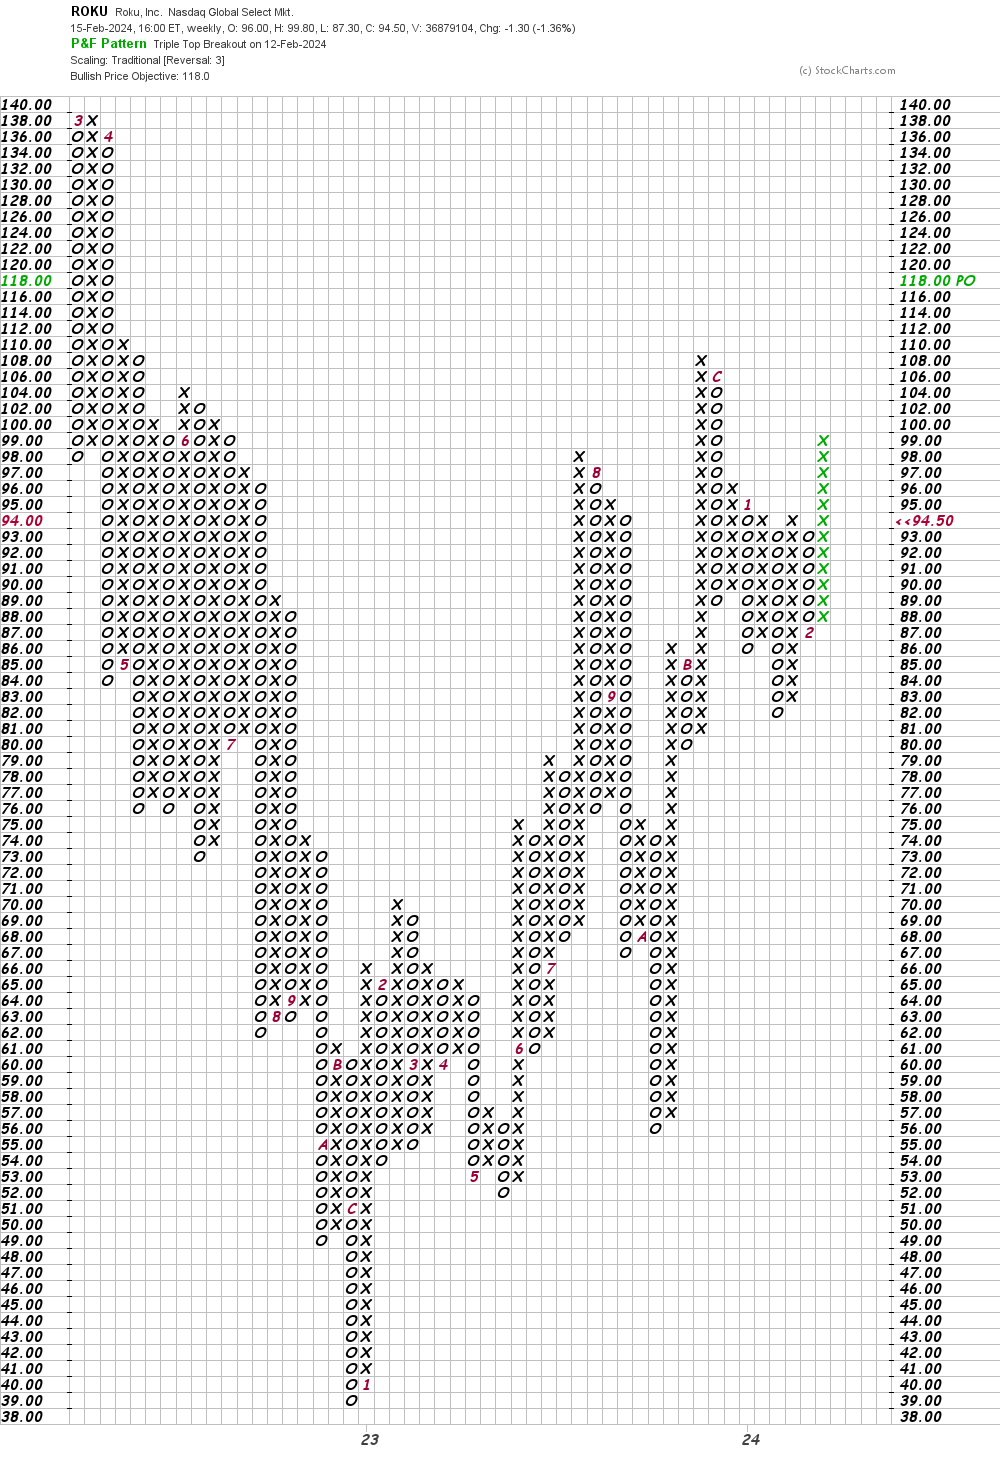
In this weekly Point and Figure chart of ROKU, below, I see an upside price target but that could change by the close here on Friday. We'll see.
Bottom line strategy: A close below the mid-January low will weaken the charts of ROKU. Don't fight the price action.
Employees of TheStreet are prohibited from trading individual securities.