Monster Beverage Badly Needs a Caffeine Boost
Is the selloff over? Let's check the charts.
You've reached your free article limit
You've read 0 of 1 free Pro articles.
Shares of Monster Beverage Corp MNST have weakened since May but the selloff may not be over just yet. Let's check out the charts and indicators.
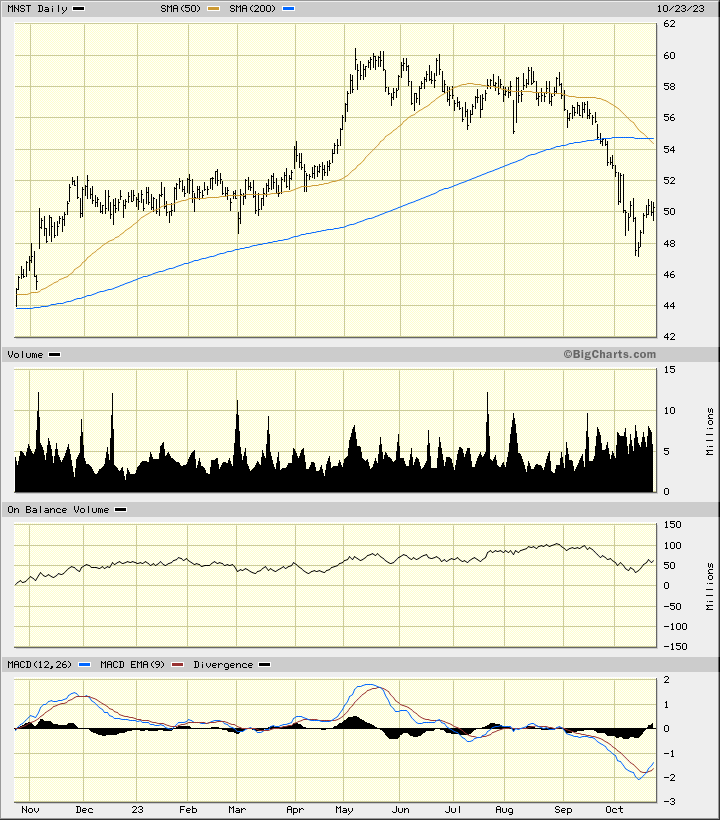
In this daily bar chart of MNST, below, I can see that prices have declined for nearly six months. Prices trade below the negatively sloped 50-day moving average line and below the cresting 200-day line. Just the other day the 50-day line broke below the 200-day line for a bearish dead or death cross sell signal. Trading volume has increased the past seven weeks as traders have decided to vote with their feet.
The On-Balance-Volume (OBV) line shows weakness since late August. The Moving Average Convergence Divergence (MACD) oscillator is below the zero line but has crossed to the upside for a cover shorts buy signal.
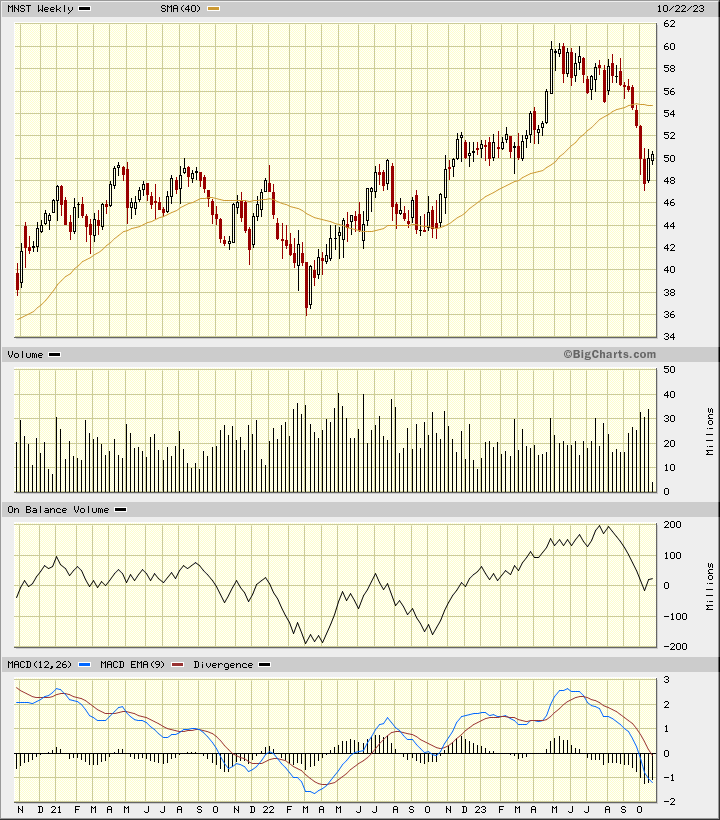
In this weekly Japanese candlestick chart of MNST, below, I see a bearish picture. Prices trade below the 40-week moving average line whose slope just turned negative. The weekly OBV line has made a sharp decline in recent months telling me that sellers of MNST have been very aggressive. The MACD oscillator is bearish with its recent move below the zero line.
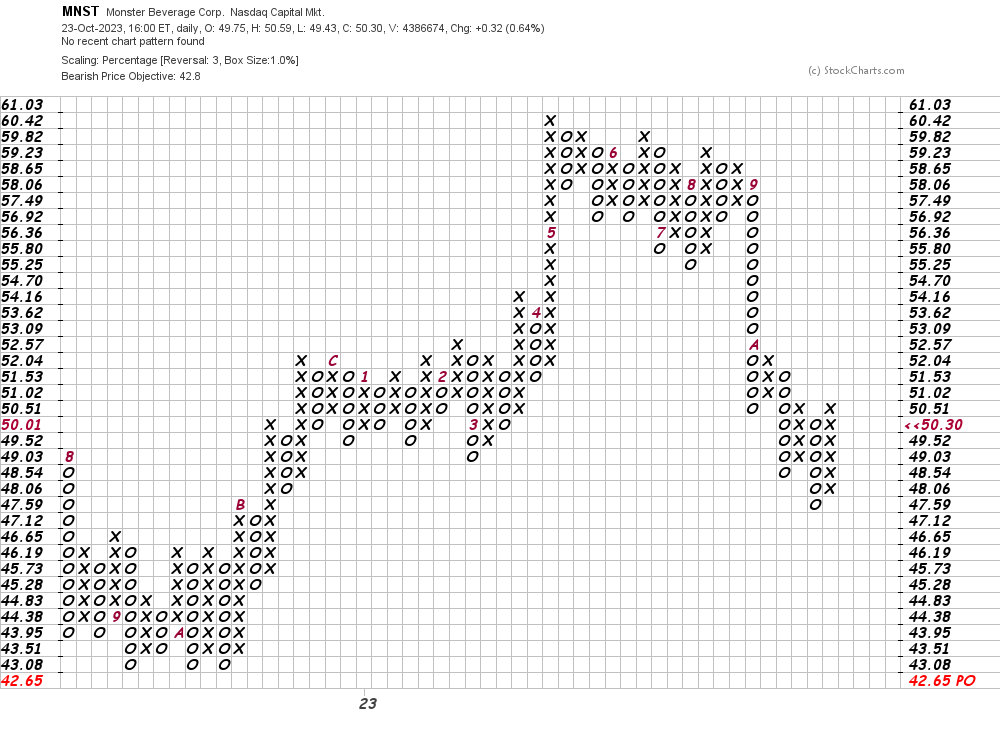
In this daily Point and Figure chart of MNST, below, I can see a potential downside price target in the $43 area.
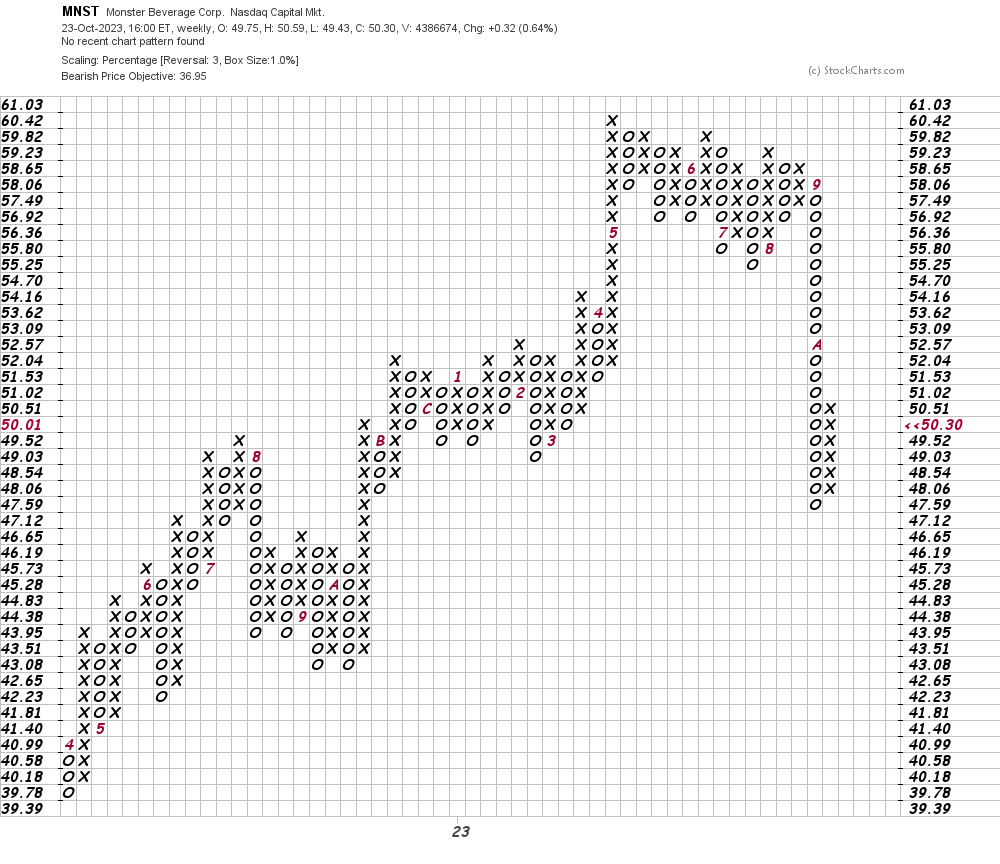
In this weekly Point and Figure chart of MNST, below, I can see a price target in the $37 area.
Bottom line strategy: I have no special knowledge of what MNST will tell shareholders when they report earnings in early November but the charts look vulnerable to further losses in the weeks ahead.
Employees of TheStreet are prohibited from trading individual securities.