Gold Makes Its Long-Awaited Breakout: My Price Targets and Strategy
Prices have broken out on the upside from a three-plus year consolidation pattern.
You've reached your free article limit
You've read 0 of 1 free Pro articles.
Gold! Yes Gold!
I go off on vacation and the yellow metal makes its long-awaited upside breakout.
Let's check out the latest charts and indicators.
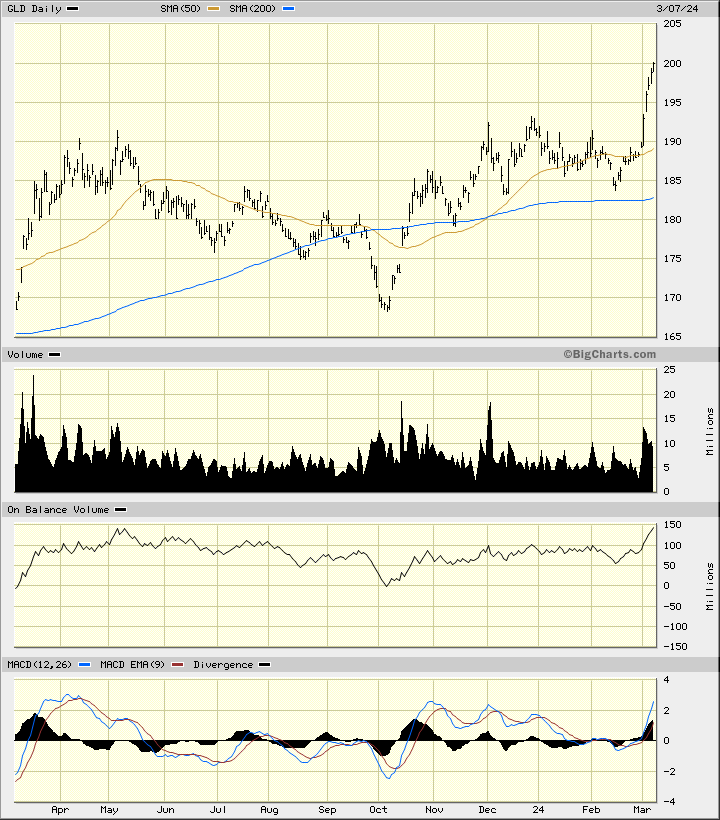
In the updated daily bar chart of GLD, the gold ETF, below, I can see that the shares have surged higher in the past week or so. Prices have broken above the highs of December. GLD is trading above the rising 50-day moving average line and above the rising 200-day moving average line.
The daily trading volume histogram shows an increase in volume in recent days. The daily On-Balance-Volume (OBV) line shows strength since the middle of February and is poised to make a new high for the move up. The trend-following Moving Average Convergence Divergence (MACD) oscillator is in a bullish alignment above the zero line.
In this first weekly Japanese candlestick chart of GLD, below, I can see the past three years of price action. Prices have broken out over the highs of the past two years. Prices trade above the rising 40-week moving average line.
The weekly OBV line is steady and the MACD oscillator is bullish and turning higher.
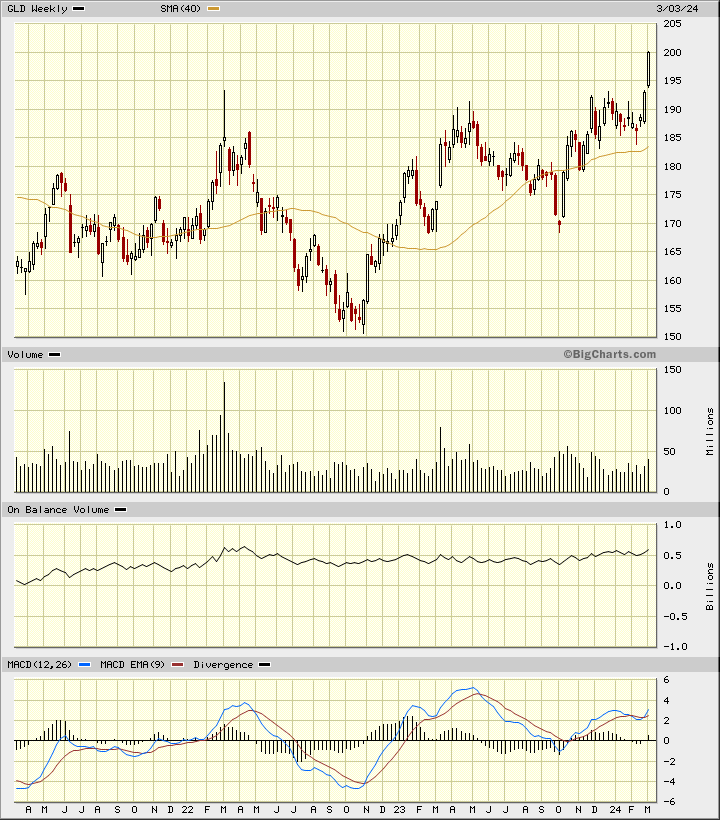
In this longer-term weekly Japanese candlestick chart of GLD, below, I can see that prices have broken out on the upside from a three-plus year consolidation pattern.
The weekly OBV line is firm and confirms the price action. The MACD oscillator is bullish and prices are trading firmly above the rising 40-week moving average line.
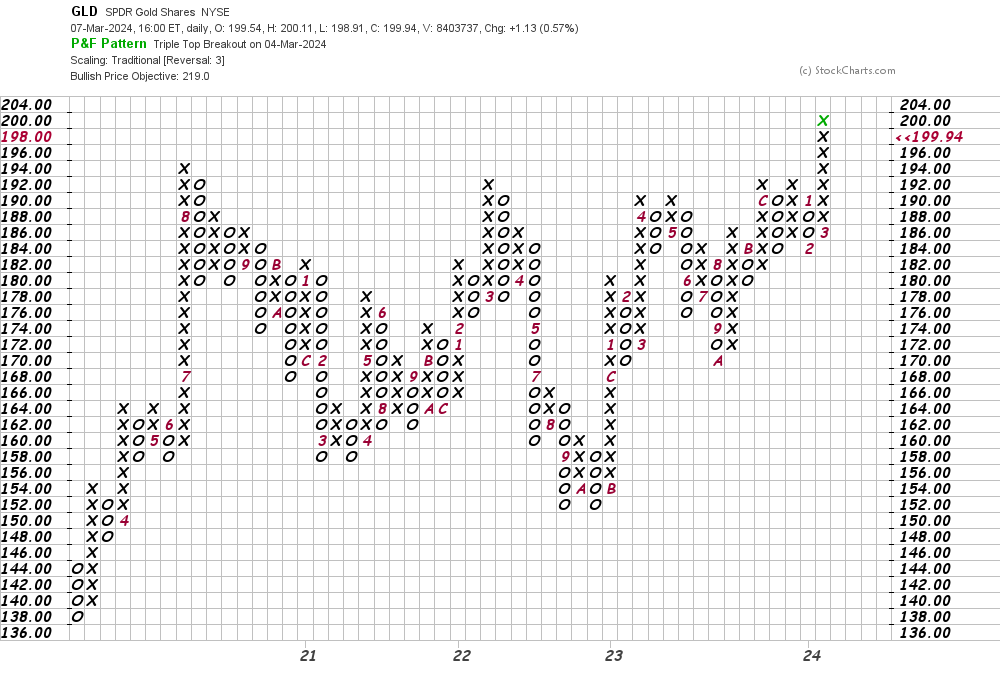
In this daily Point and Figure chart of GLD, below, I can see the upside breakout at $196 and a price target in the $219 area.
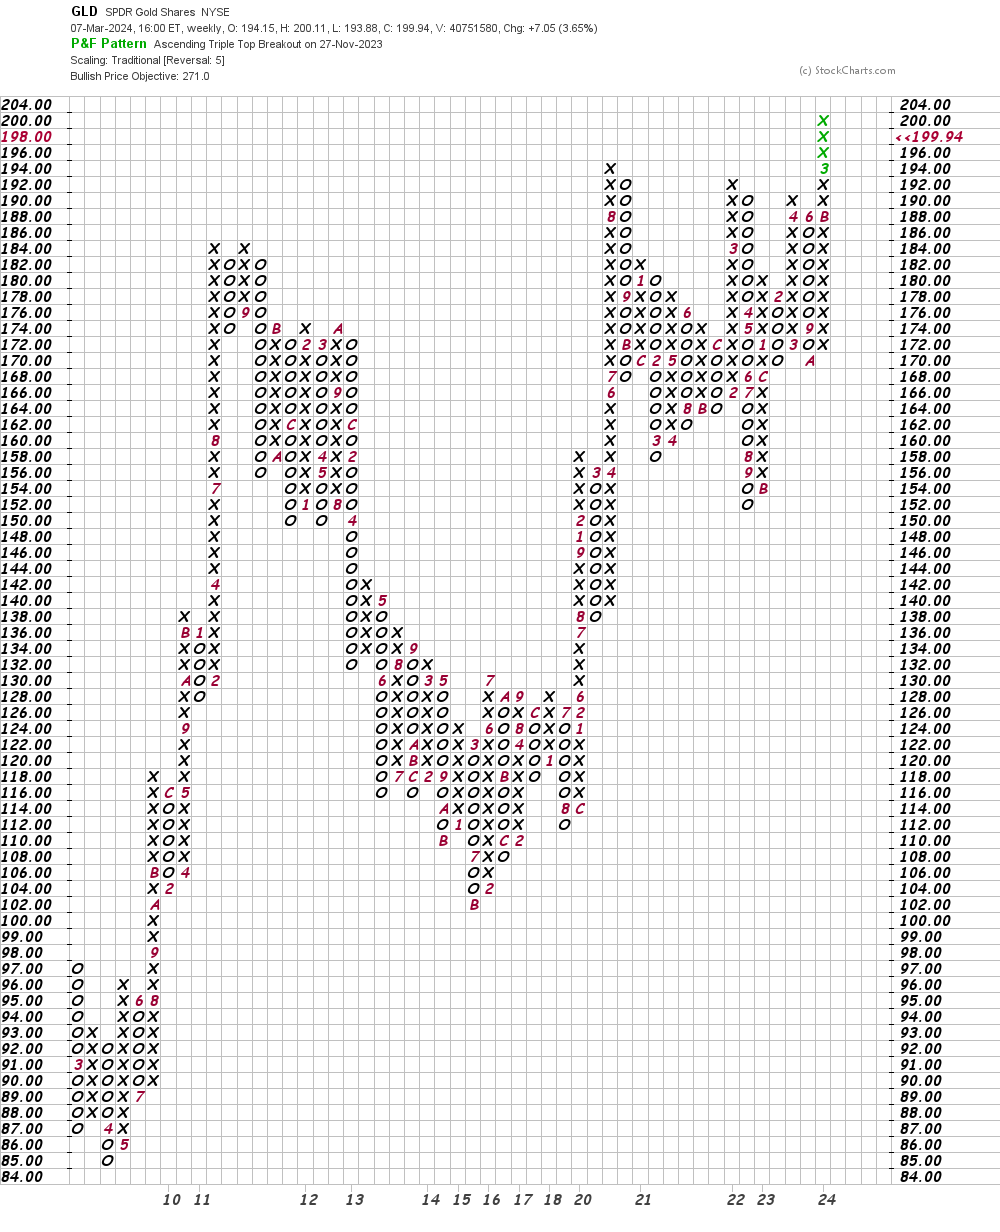
In this first weekly Point and Figure chart of GLD, below, I used a five-box reversal filter. Here I can see a potential upside price target in the $271 area.
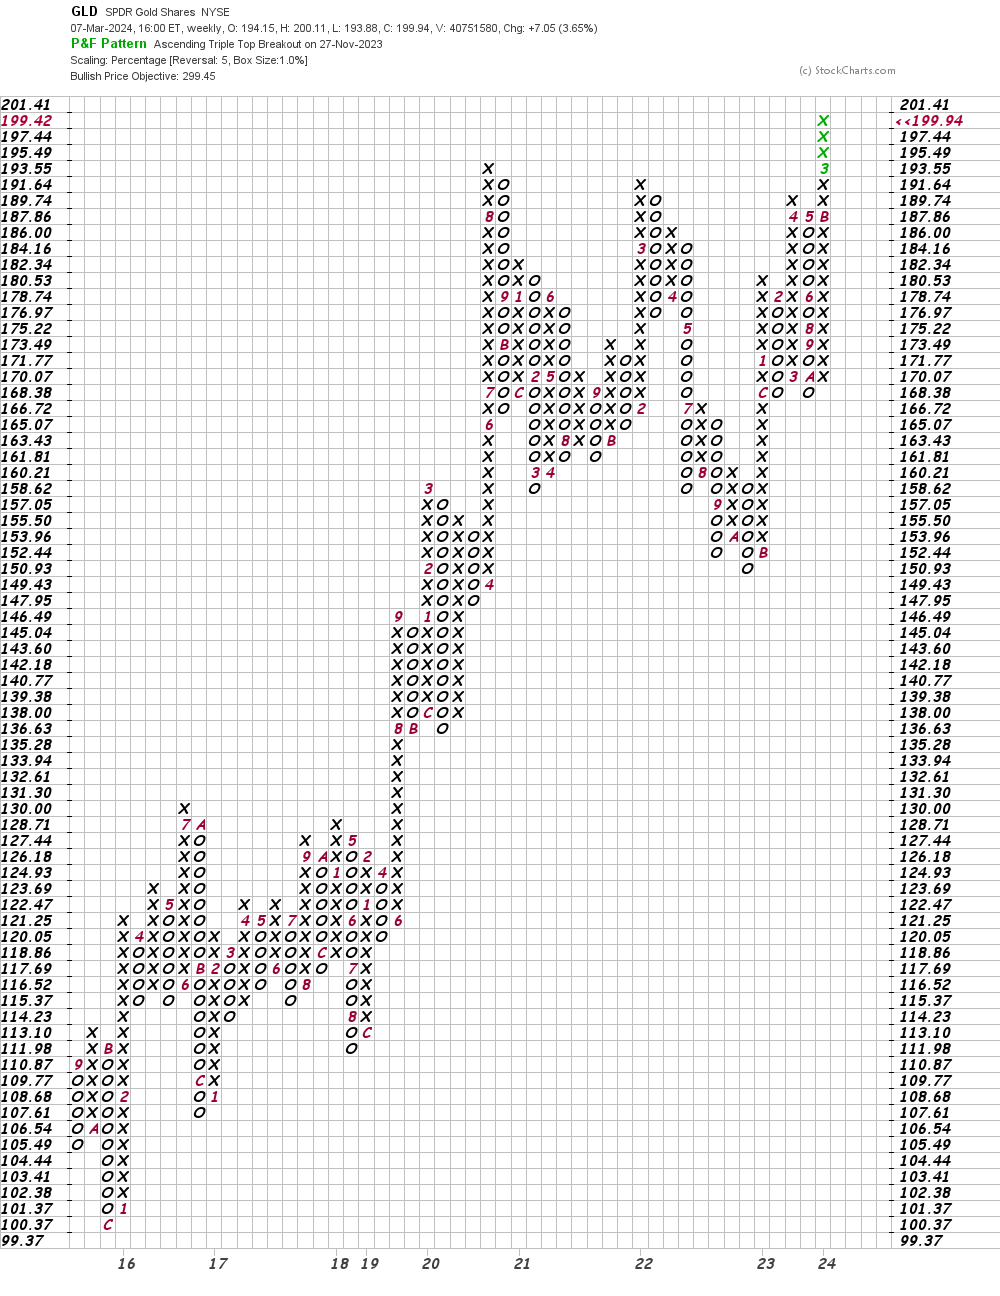
In this second Point and Figure chart of GLD, below, I used weekly price data using percentage changes and a five-box reversal filter. This suggests a price target in the $299 area. Let's call it $300. Round numbers can be magnets at times.
Bottom-Line Strategy
Nearby gold futures are closing in on the $2,200 area and "gold fever" has not started to surface yet.
Traders new to the precious metals market should consider buying a precious metals mutual fund for part of their allocation to this "sector."
Aggressive traders could buy or add to longs on a one-to two-day dip in the GLD. Sell stops need to be at least below $2,150 for now based on the futures market.
Employees of TheStreet are prohibited from trading individual securities.