Can Slumping Hain Celestial Develop a Base Pattern?
Is the big downside risk over?
You've reached your free article limit
You've read 0 of 1 free Pro articles.
Organic and natural foods maker Hain Celestial Group HAIN can be found in health food stores and you have probably seen their herbal teas in your supermarket. The stock price has suffered in the past two years and the question now is whether it can form a base pattern.
Let's check the charts and indicators.
In this daily bar chart of HAIN, below, I can see that prices have been cut in half in the past twelve months. Prices trade just above the rising 50-day moving average line but below the declining 200-day moving average line. Trading volume has been more active in September and November.
The On-Balance-Volume (OBV) line has declined the past twelve months and tells me that sellers of HAIN have been more aggressive than buyers. The Moving Average Convergence Divergence (MACD) oscillator is pointed downward and is only slightly above the zero line.
In this weekly Japanese candlestick chart of HAIN, below, I can see that HAIN has made a more serious decline than what we can see on the one-year daily chart above. Prices are trading below the declining 40-week moving average line. The weekly OBV line shows a long decline with a recovery in the past three months. The MACD oscillator has been improving but is still below the zero line.
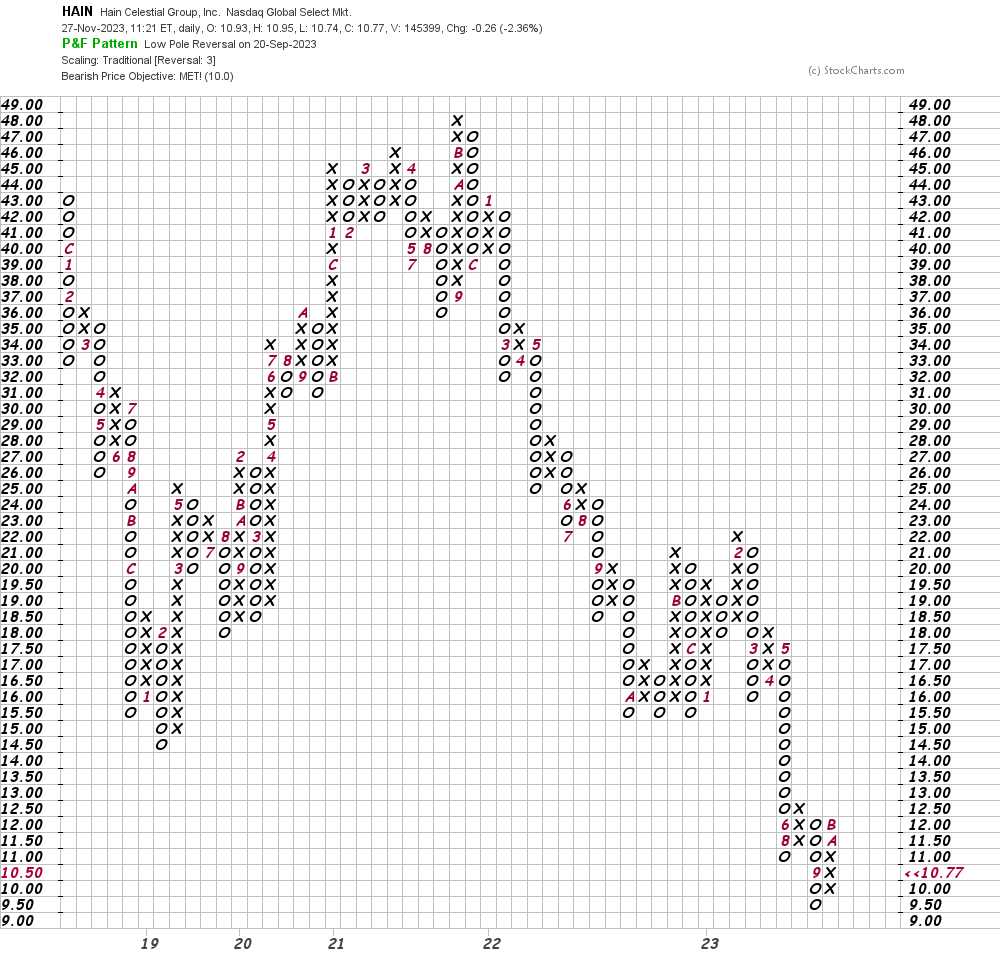
In this daily Point and Figure chart of HAIN, below, I can see that prices have reached a downside price target in the $10 area.
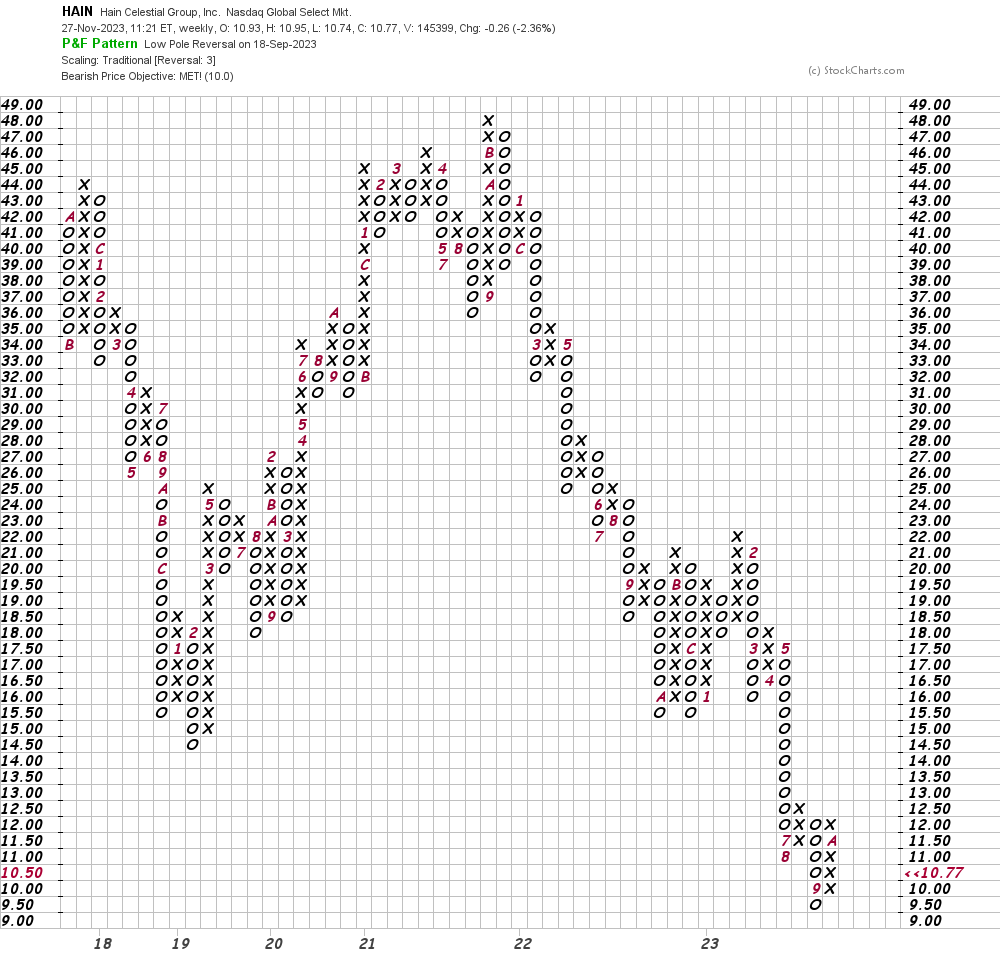
In this weekly Point and Figure chart of HAIN, below, I can see the same $10 price target being reached on a longer time frame.
Bottom line strategy: Traders and investors should be patient and wait for HAIN to make a broader base pattern even though the big downside risk may be over.
Employees of TheStreet are prohibited from trading individual securities.