Bad News Piles Up for Bayer and Its Technical Signals Aren't Pretty, Either
There simply is nothing good about its charts.
You've reached your free article limit
You've read 0 of 1 free Pro articles.
European drug and chemical maker Bayer BAYZFBAYN fell sharply here on Monday to a multiyear low as investors learned of the failing results of its blood thinner drug trial. Adding to the company's woes was a report that Bayer was ordered to pay $1.56 billion in the latest U.S. trial loss over its Roundup weed killer.
Let's check Bayer's charts and prices to see what they may reveal about the stock.
In this daily bar chart of BAYN, below, I can see that prices have been cut in half in the past 10 months. Prices trade below the declining 50-day moving average line and below the bearish 200-day line. The decline has been in place long before the latest bearish fundamental news. Trading volume has increased since June, telling me that traders are voting with their feet. The On-Balance-Volume (OBV) has been weak since February, telling us that sellers of BAYN are more aggressive than buyers. The Moving Average Convergence Divergence (MACD) oscillator has been below the zero line for much of the past year.
In this weekly Japanese candlestick chart of BAYN, below, I see a weak or bearish setup. Prices are in a longer-term downtrend and trade below the negatively sloped 40-week moving average line. The weekly OBV line is pointed down and the MACD oscillator is bearish.
In this monthly Japanese candlestick chart of BAYN, below, I can imagine today's prices and can see that this decline has taken prices back to levels not seen since 2006. These levels are so far back in history they are not going to be reliable support.
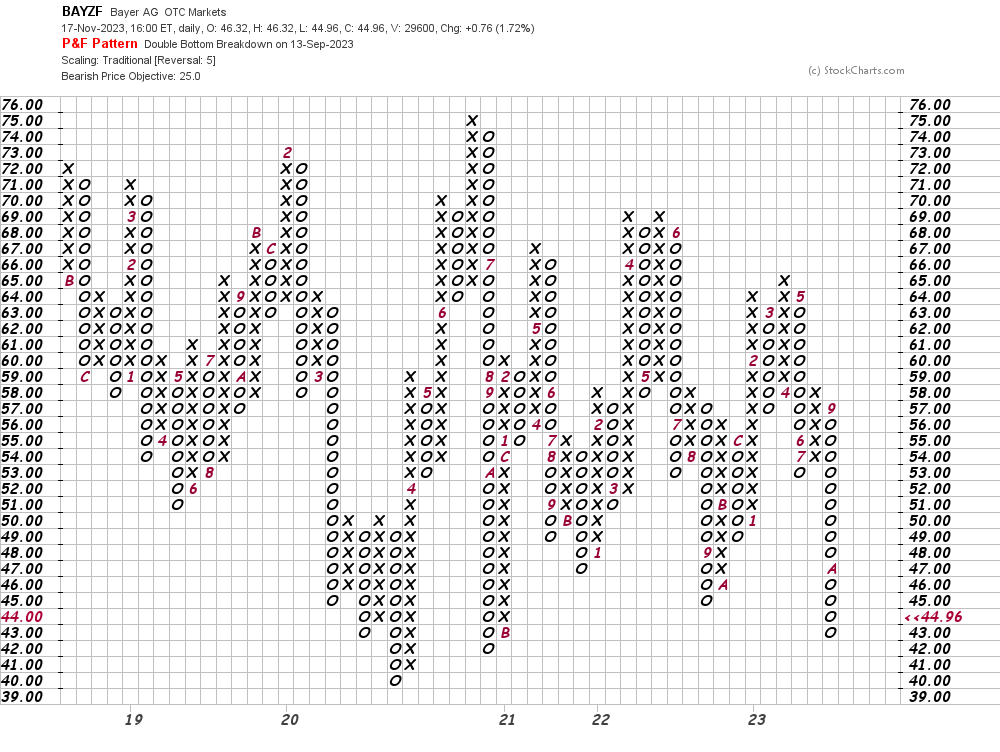
In this daily Point and Figure chart of BAYN, below, I used a five-box reversal filter and can see a potential downside price target in the $25 area.
In this weekly Point and Figure chart of BAYN, below, I can see the same $25 price target that is shown on the daily chart above.
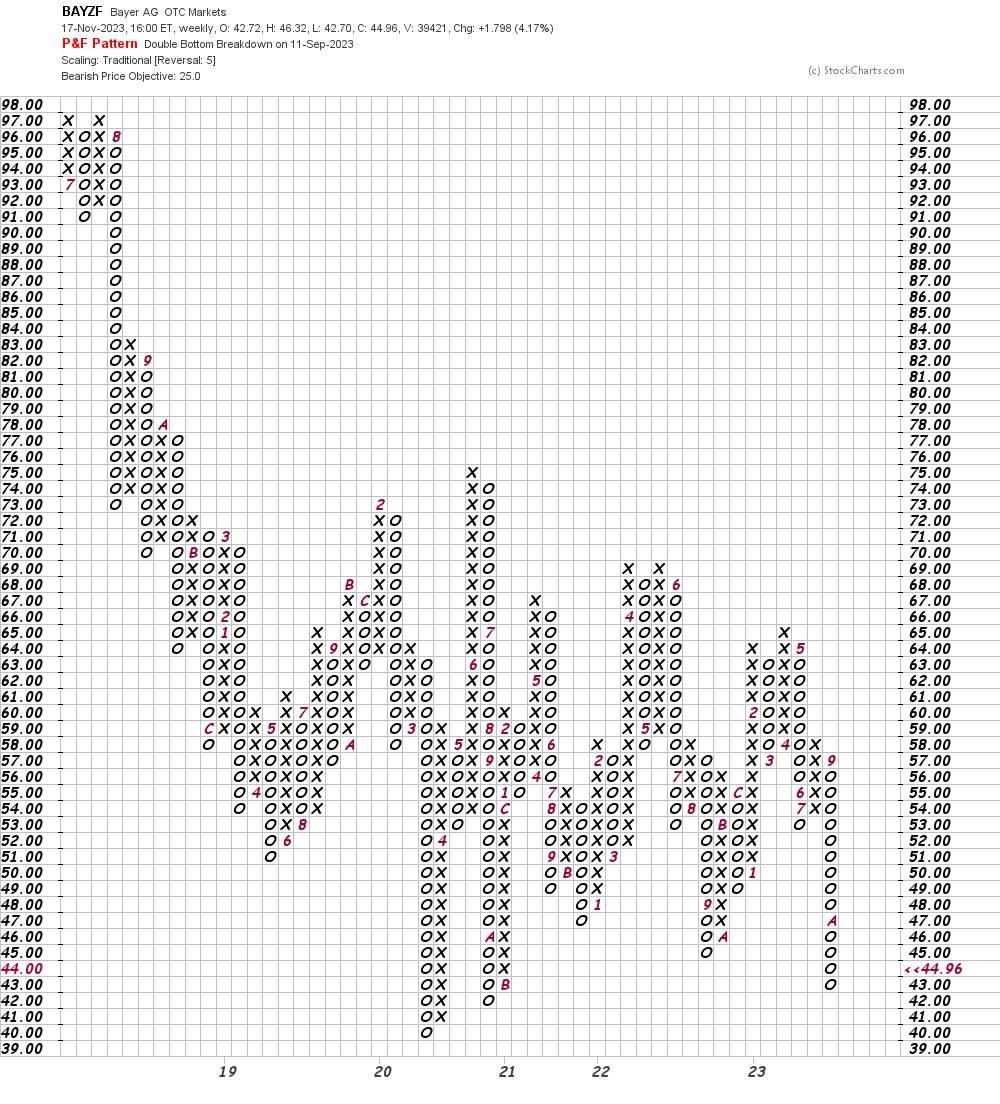
Bottom line strategy: All five charts of BAYN are negative. Avoid the long side of BAYN.
Employees of TheStreet are prohibited from trading individual securities.