Arista Networks Is Showing Potential for Arresting Upside
Here's what we're seeing and how to play shares of the cloud networking firm.
You've reached your free article limit
You've read 0 of 1 free Pro articles.
Shares of cloud networking firm Arista Networks ANET have trended higher since late 2020. Can the rise continue or should we grow cautious?
Let's check out the charts and indicators.
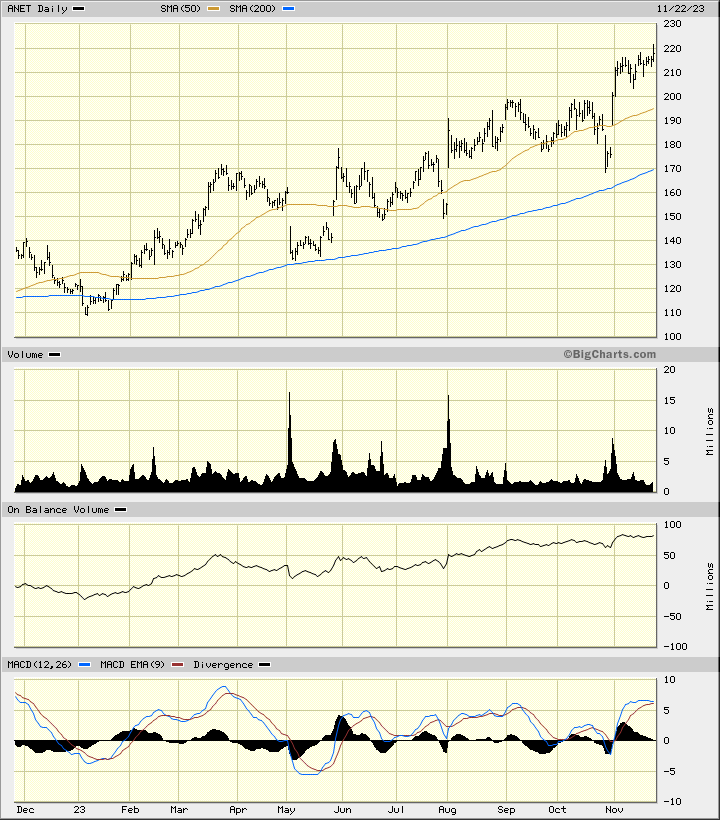
In the daily bar chart of ANET, below, I can see that the shares have worked higher on the chart with about five downside corrections along the way. ANET now trades above the rising 50-day moving average line and above the rising 200-day moving average line.
The daily trading volume does not show me a pattern of increasing volume but the On-Balance-Volume (OBV) shows a rising pattern since the beginning of the year. The Moving Average Convergence Divergence (MACD) oscillator is above the zero line but it has narrowed sharply and could cross to a take profits sell signal.
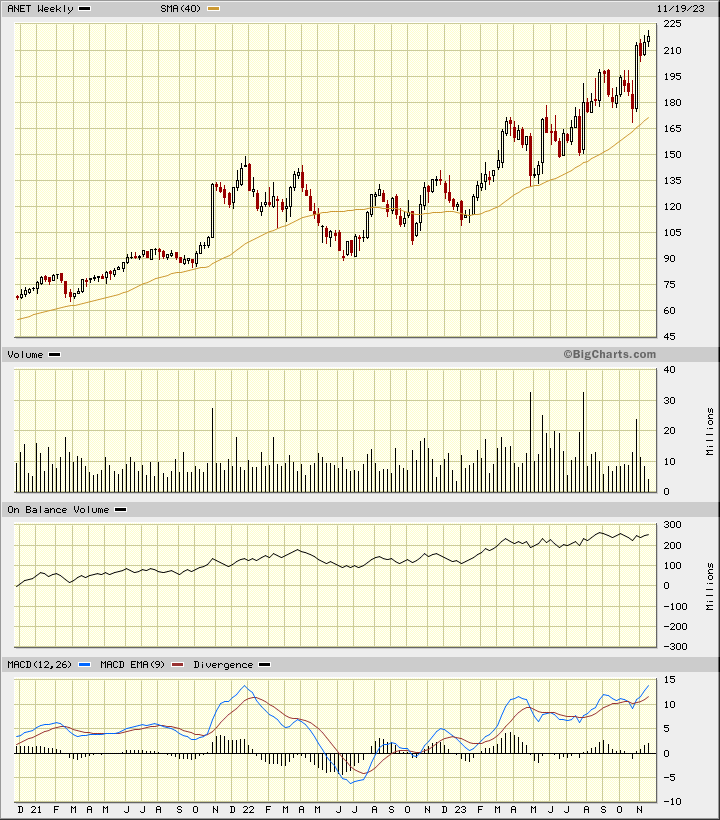
In the weekly Japanese candlestick chart of ANET, below, I can see a positive setup. The shares are in a longer-term uptrend and trade above the rising 40-week moving average line.
The weekly OBV line shows me a long-term rise but the last three months the line has moved sideways. The Moving Average Convergence Divergence (MACD) oscillator is in a positive trend above the zero line.
The candle pattern is a spinning top and could become part of a top reversal pattern. We need to watch this.
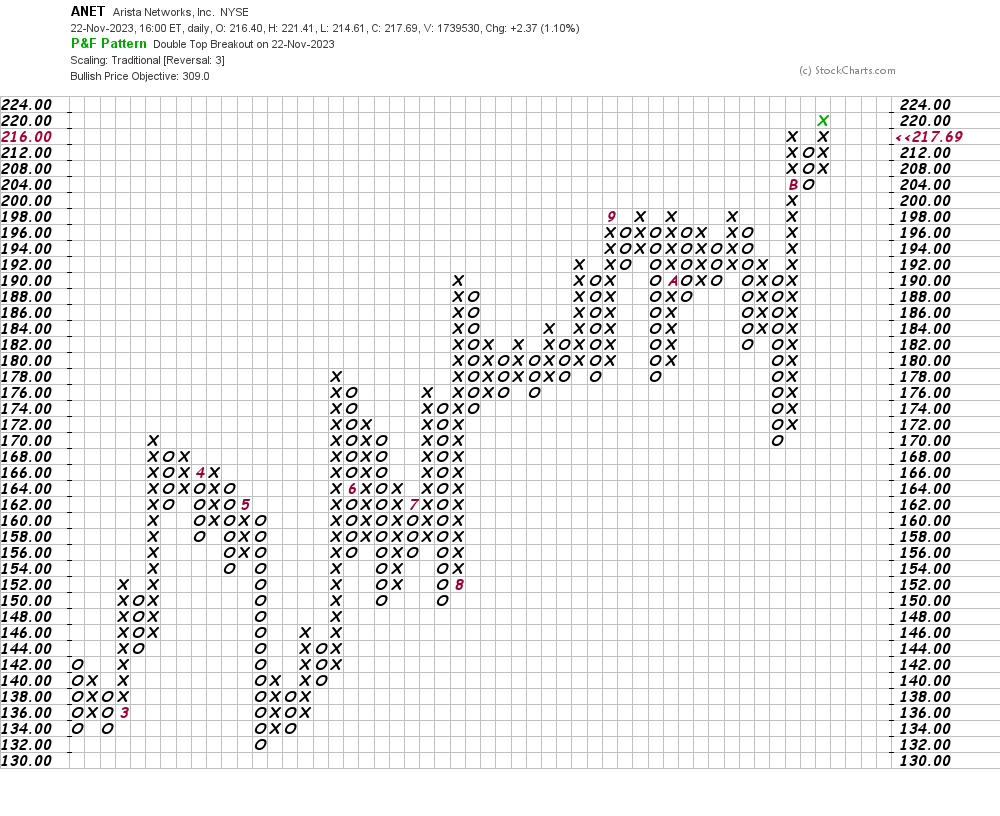
In this daily Point and Figure chart of ANET, below, I can see an impressive upside price target in the $309 area.
In this weekly Point and Figure chart of ANET, below, it projects a target in the $321 area.
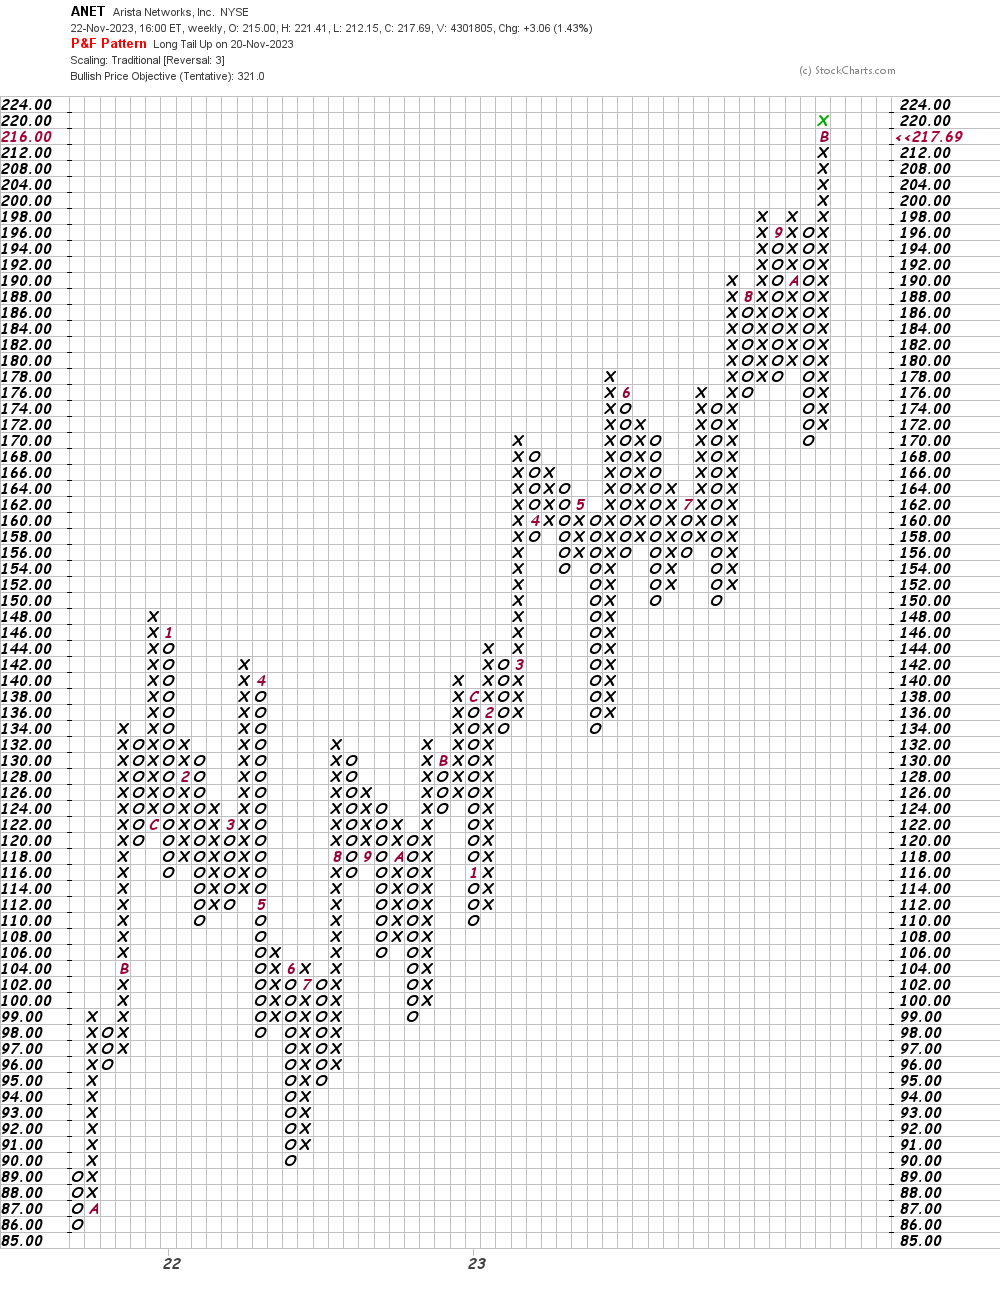
Bottom-line strategy: Traders could go long ANET at current levels risking to $201. The round number of $300 is my price target.
Employees of TheStreet are prohibited from trading individual securities.