Friday’s After Hours % Advancers, % Decliners
BY Doug Kass · Sep 4, 2026, 4:35 PM EDT
 Doug KassDoug Kass
BY Doug Kass · Sep 4, 2026, 4:35 PM EDT
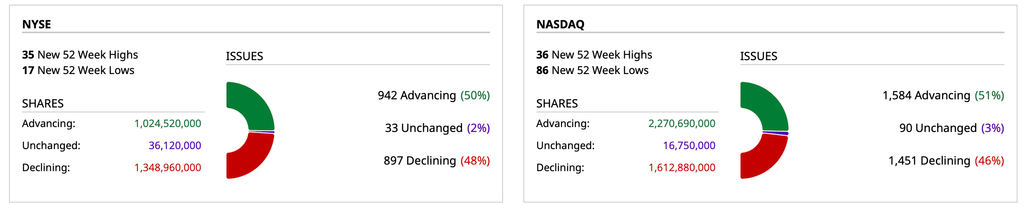
Volume
– NYSE volume 13% below its one-month average;
– NASDAQ volume 15% below its one-month average;
– VIX index: up 1.40% to 14.52
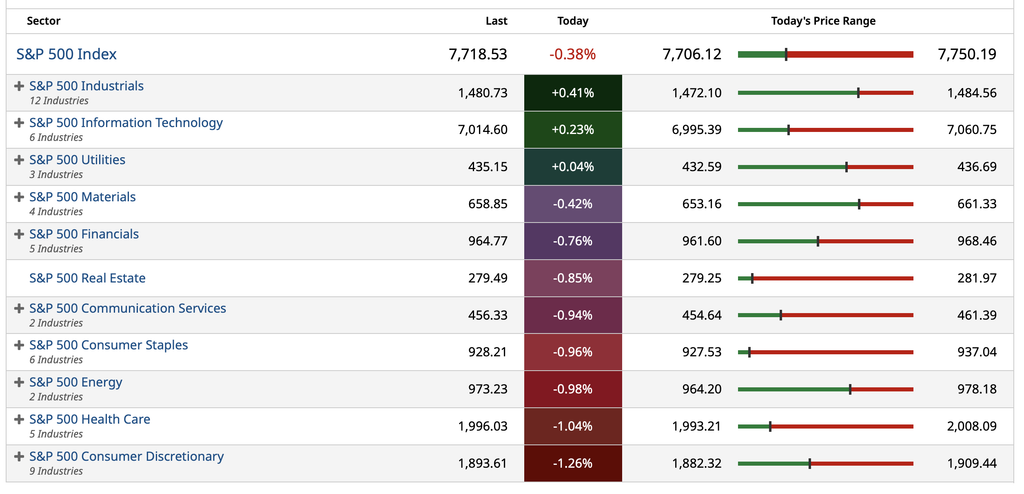
Sectors
% Gainers and Decliners
Source: TipRanks
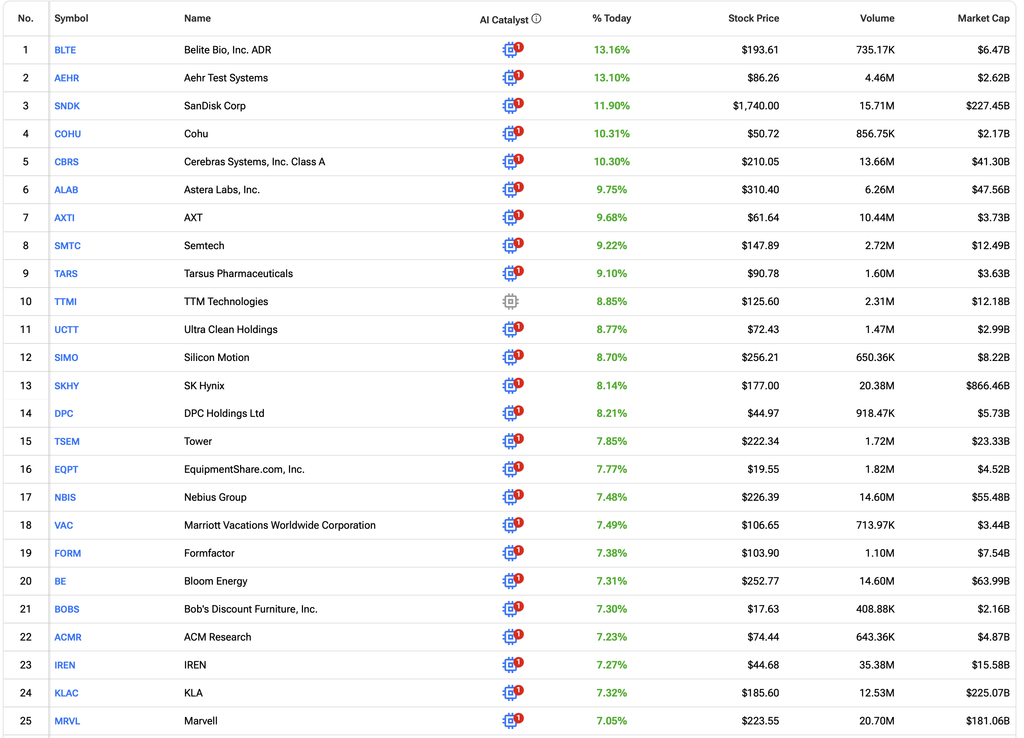
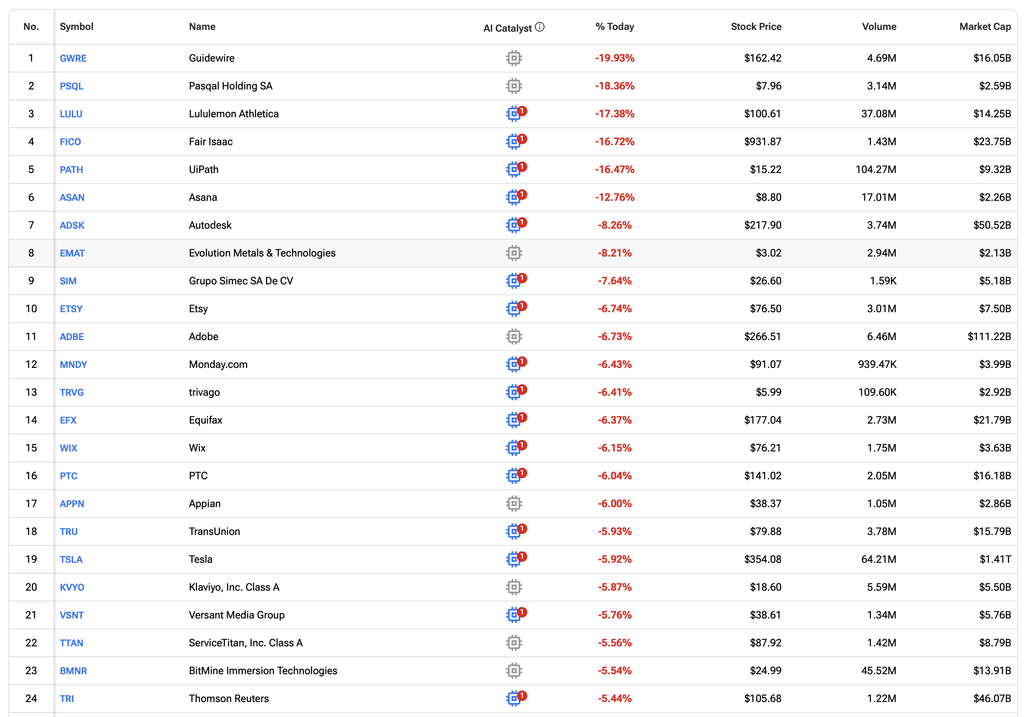
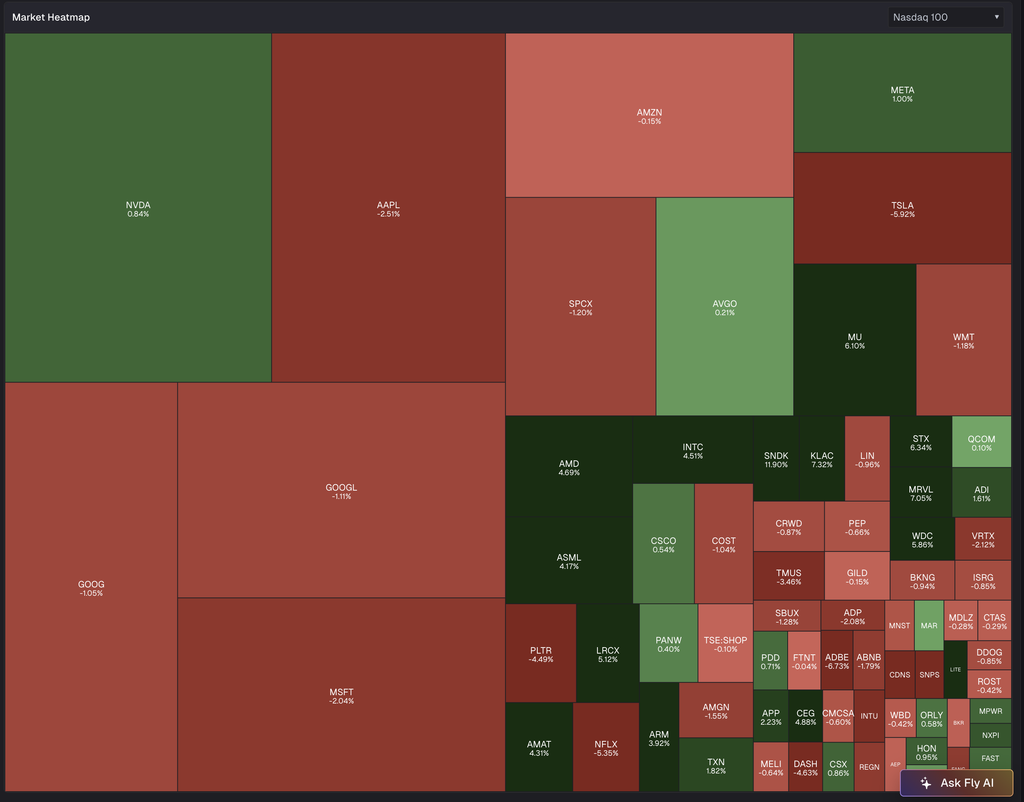
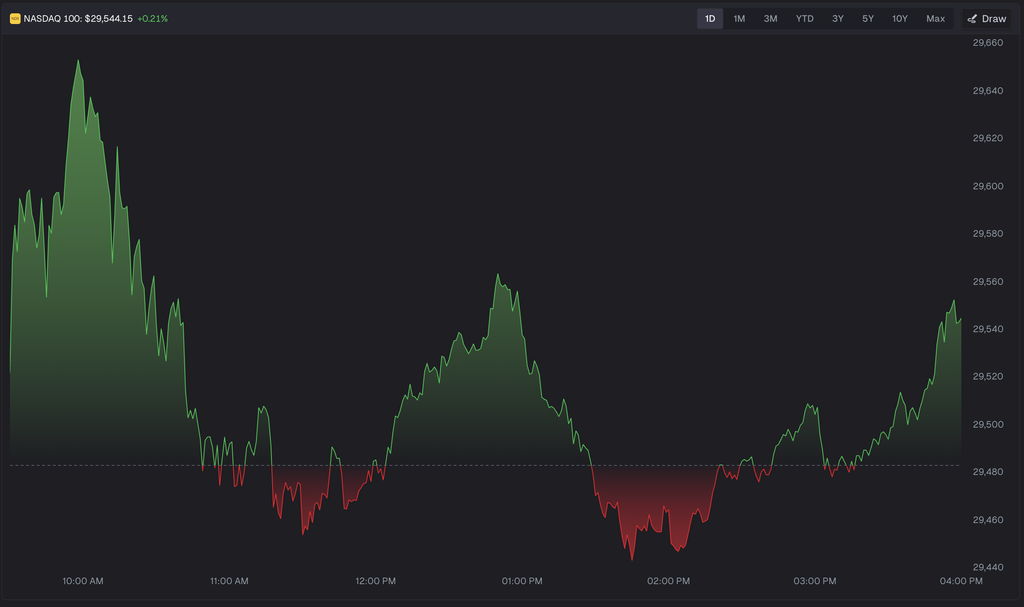
Nasdaq 100 and S&P 500 Heat Maps
Source: TheFly
BY Doug Kass · Sep 4, 2026, 4:25 PM EDT
I wanted to wish everyone a fun and relaxing long Labor Day weekend.
Thanks for reading my Diary all week.
Though I was preoccupied with a series of illnesses, I hope you found my contributions value added.
As mentioned earlier today, I will be out of the office and not writing Tuesday to Thursday, as I have to attend to a family member who is having surgery. (I hope that is the end of the drama of the last month!)
Be safe.
Positions: None.
BY Doug Kass · Sep 4, 2026, 3:30 PM EDT
Wolf Street howls about the jobs market.
“Turns Out, the Labor Market is OK Despite All Moaning & Groaning about the Economy or Whatever“
Position: None.
BY Doug Kass · Sep 4, 2026, 3:00 PM EDT
From Scott Galloway’s “No Mercy No Malice”
Positions: None.
BY Doug Kass · Sep 4, 2026, 2:43 PM EDT
In the near term, we still cannot rule out the possibility of some market weakness and volatility in seasonally weak September or later in the year. The Fed appears to be uncertain about everything other than the obvious, inflation is still above its stated 2% target. And the war with Iran is a shooting war once again. Some clarity on either front would likely be welcome by the market but until that arrives the market remains susceptible to headlines.
Strong S&P 500 August
S&P 500 finished August 2026 with a solid 2.62% gain, placing this year in the top third of August performances since 1950, according to the historical data in the accompanying table. The question now is whether that strength can carry beyond August into the remainder of the year or whether September’s notorious seasonal weakness will interrupt the advance.
History offers an interesting answer. Among the top third August performers, S&P 500 has gained an average of 4.4% in August, followed by an average 0.8% decline in September. September has been higher just 32% of the time in these years, with 17 declines versus only 8 advances. But the weakness has generally been temporary. S&P 500 gained an average of 1.3% (2.8% median gain) during the rest of the year, resulting in a respectable 9.1% average full-year gain.
The contrast with weak August years is striking. When August falls into the bottom third, S&P 500 has averaged a 4.9% loss in August and another 1.2% decline in September, before rebounding with a 4.7% average gain during the remainder of the year. Full-year performance also slumped significantly to an average gain of 5.1% with just 52.0% of the years finishing higher.
When August landed in the middle third of S&P 500 performance rankings, September was notably stronger than the top third or bottom third, up 57.7% of the time with an average gain of 0.1%. Rest of the year performance matched the bottom third while full year performance was the best with an average gain of 14.2% (median of 19.3%), and higher 88.5% of the time.
An above average August has not historically eliminated September risk. The possibility of a September pause and/or pullback still remains.
Employment Data Catalyst
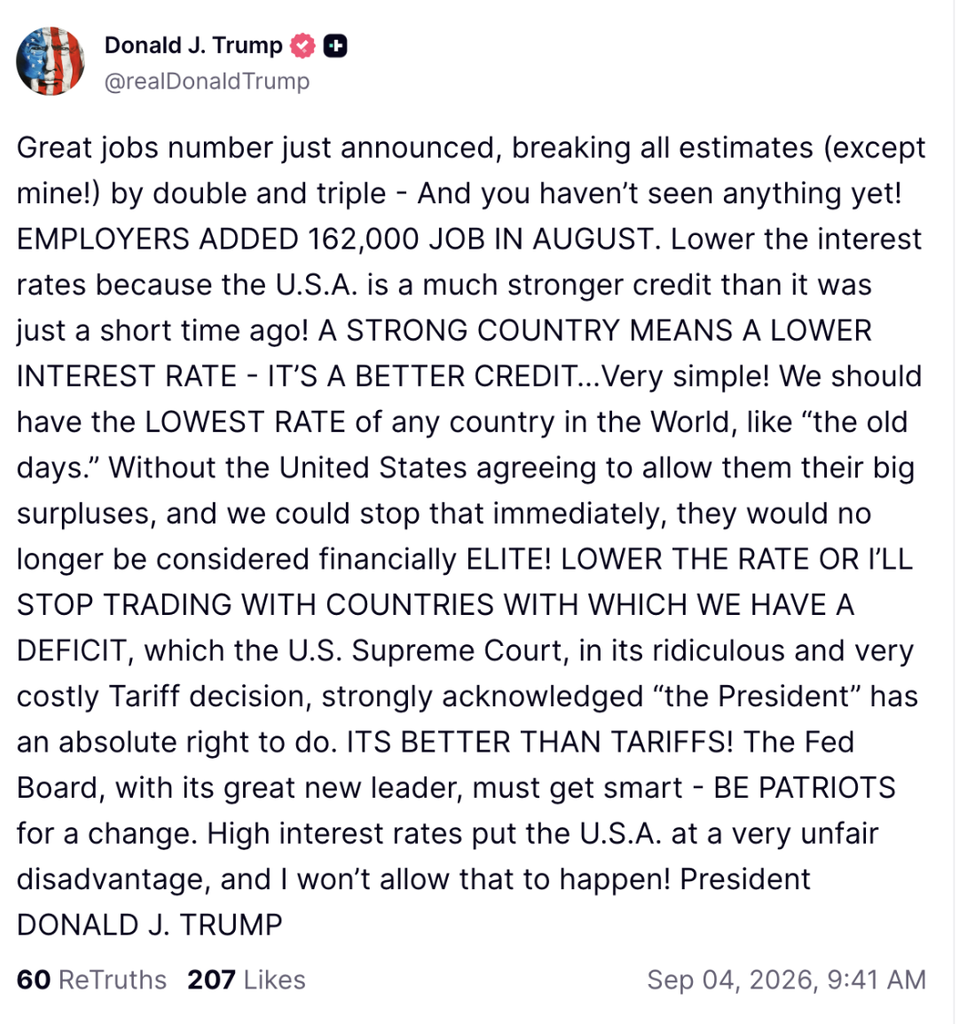
Tomorrow morning, the market’s attention will likely be keenly focused on the August Employment Situation report, as traders and investors look for clues about the health of the labor market and the Fed’s next move with interest rates. Current estimates call for a modest rebound in hiring, with forecasts generally around 50,000–65,000 new nonfarm payrolls and an unemployment rate of approximately 4.2%. FactSet’s latest median estimate is 65,000 jobs and a 4.2% unemployment rate.
That would represent an improvement from July, when payrolls declined by 23,000. But Wednesday’s ADP report provided little evidence of a dramatic labor-market rebound. Private employers added just 38,000 jobs in August, below the 48,000 expectation. The gain was also ADP’s weakest since January, with manufacturing and professional/business services among the sectors shedding jobs.
Historically, the September employment report has had a mixed response from stocks. Since 2004, S&P 500 has gained on September Employment Report Day in 11 of 22 years, producing an average decline of 0.24% and a median change of just –0.03%. NASDAQ has been weaker, rising only 9 times (down seven of the last eight years) and averaging –0.37%.
The jobs data could have major implications for Fed policy. A significantly weaker-than-expected report would reinforce concerns that employment is deteriorating and could weaken the case for further rate hikes. Conversely, a stronger report could bolster the Fed’s hawkish stance. As of ~4pm EDT on September 3, the CME Group’s FedWatch Tool has the odds of a September Fed rate hike at a hair splitting 50.4%.
In short, Friday’s report has the potential to be a market mover. A weak number could revive hopes for easier monetary policy, while a stronger-than-expected jobs report could reinforce the Fed’s hawkish posture and add another layer of uncertainty to an already seasonally challenging September.
Bitcoin’s Seasonal Low
No Sector Seasonalities from page 94 of the 2026 Almanac begin or end in September. However, back in 2023, Jeff Hirsch teamed up with Adrian Zdunczyk, CMT, Founder and CEO of THE BIRB NEST® (@Crypto_Birb) to create “The Seasonality of Bitcoin” report. The original report is still available here or by copying and pasting this link into a new browser window: https://www.stocktradersalmanac.com/UploadedDocument/Seasonality _of_Cryptocurrency_Report.pdf.
Since the release of the report back in 2023, we have been tracking bitcoin on a consistent basis in the monthly member’s only webinar. Included in the September 2026 slides are a pair of updated seasonal charts of bitcoin. One chart compares 2026 to all years and the second includes bitcoin’s seasonal trend in midterm years. Both charts point to a typical seasonal low in September or October. This year, it looks like bitcoin hit its low early and is now potentially breaking out back above $80,000.
The above chart is iShares Bitcoin Trust (IBIT), our preferred ETF to trade the seasonal setup in Bitcoin. It is highly liquid, easily accessible and has relatively low fees. There are other ETFs available that also track Bitcoin, which are also perfectly fine options, but IBIT is the one we will use. We strongly encourage taking a moment and visiting www.ishares.com to review all relevant documents and information prior to executing any trade in IBIT.
Bitcoin and IBIT bounced off of their respective late-July lows and spent July and the first half of August trading effectively sideways before leaping to just below current levels in the second half of August. IBIT has reclaimed its 20-, 50-, and 200-day averages and MACD is positive and trending higher. IBIT can be considered near current levels or on dips below a buy limit of $46.00. This price appears to correlate to a Bitcoin price of around $81,000. For tracking purposes, IBIT will be added to the Almanac Investor Sector Rotation ETF Portfolio using its average price on Friday September 4.
Given the amount of volatility Bitcoin and IBIT have exhibited recently, there is no suggested stop loss at this time. There is also a possibility that the current breakout, above $80,000, triggers some profit taking and a period of consolidation. Should this transpire, there will likely be opportunity to purchase IBIT at less than the buy limit. The midterm year low for bitcoin is most likely in. Given its historical performance off past midterm lows, Bitcoin’s new bull market likely has substantial upside remaining.
Positions: None.
BY Doug Kass · Sep 4, 2026, 12:45 PM EDT
With S&P cash -25 handles, I am shorting slightly in the money (monthly) calls for October.
Positions: Short SPY calls (VS).
BY Doug Kass · Sep 4, 2026, 12:25 PM EDT
I have covered the balance of my (SPY) (common) short at $769.54.
I will re-short strength.
A long weekend lies ahead and I will be out of the office until a week from today.
Positions: None
BY Doug Kass · Sep 4, 2026, 11:45 AM EDT
Volume
– NYSE volume 11% below its one-month average;
– NASDAQ volume 15% below its one-month average;
– VIX index: down 1.40% to 14.12
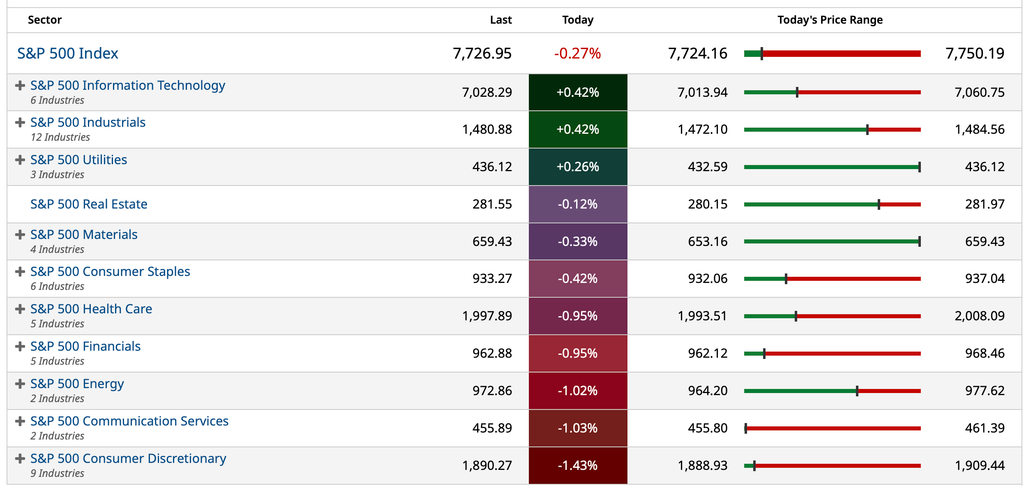
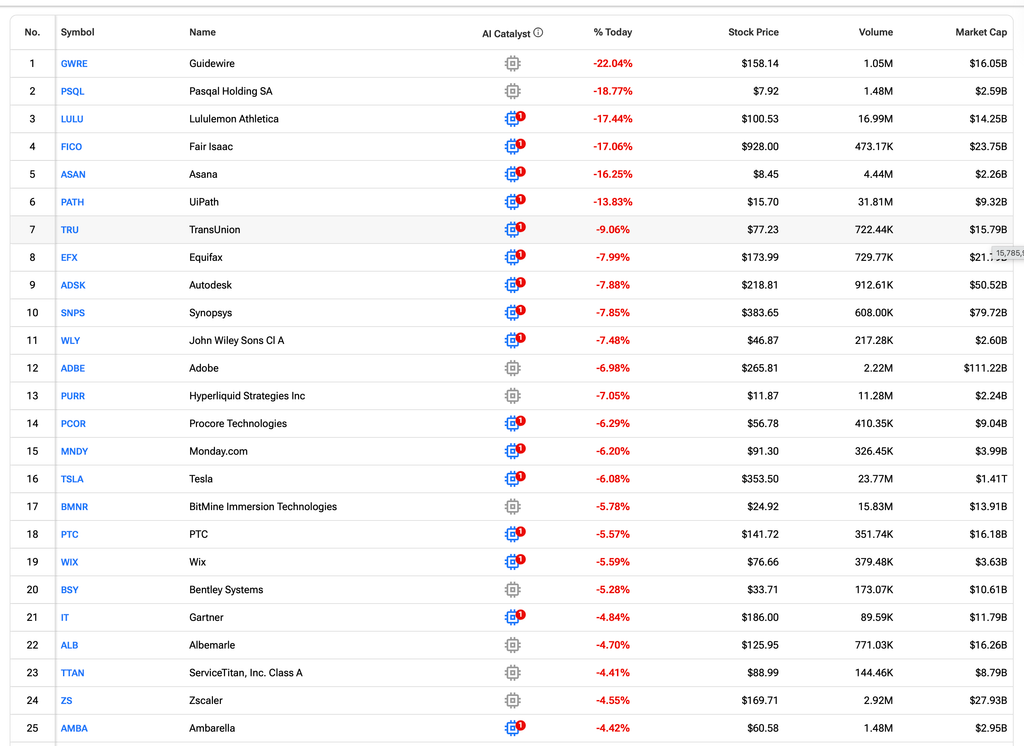
Sectors
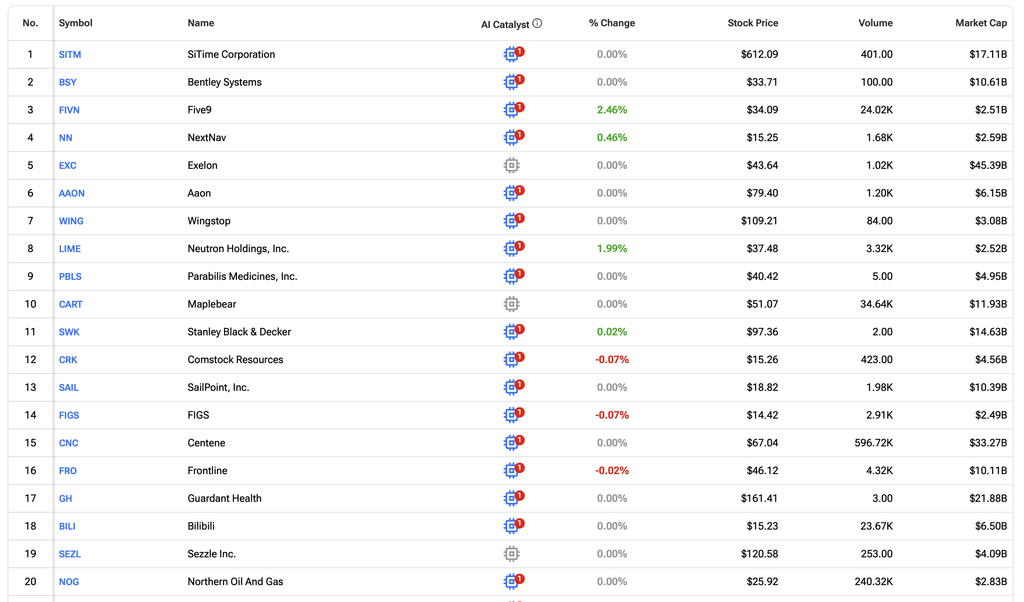
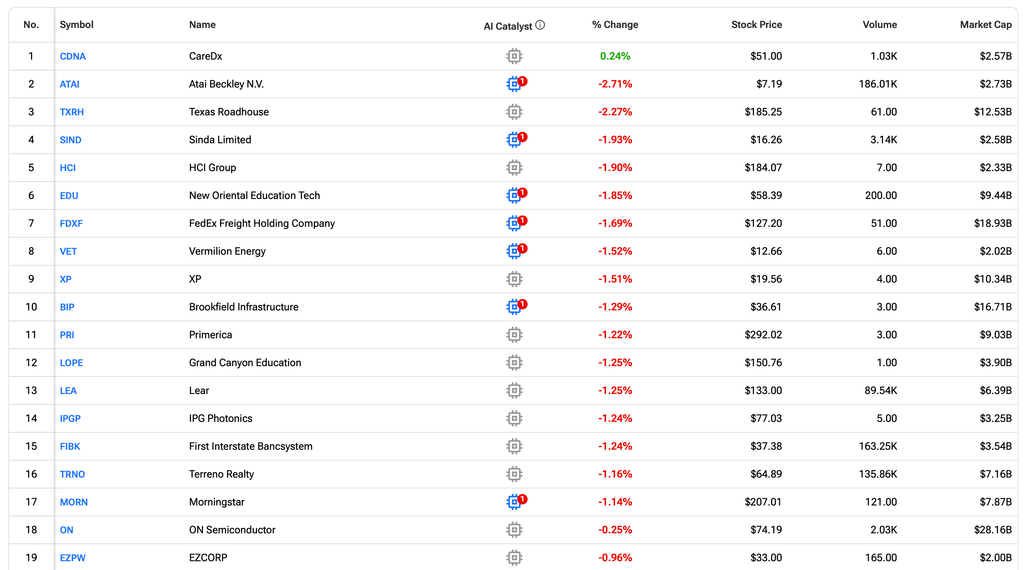
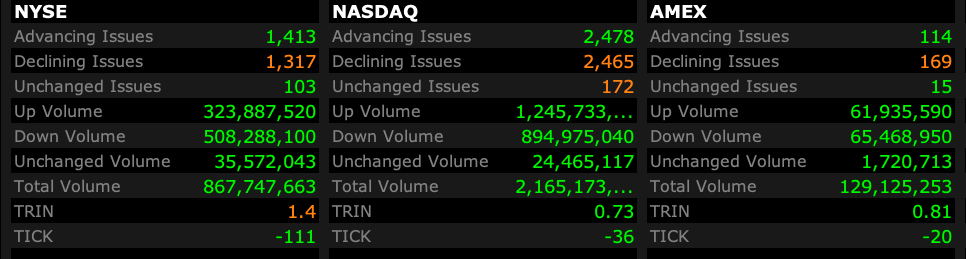
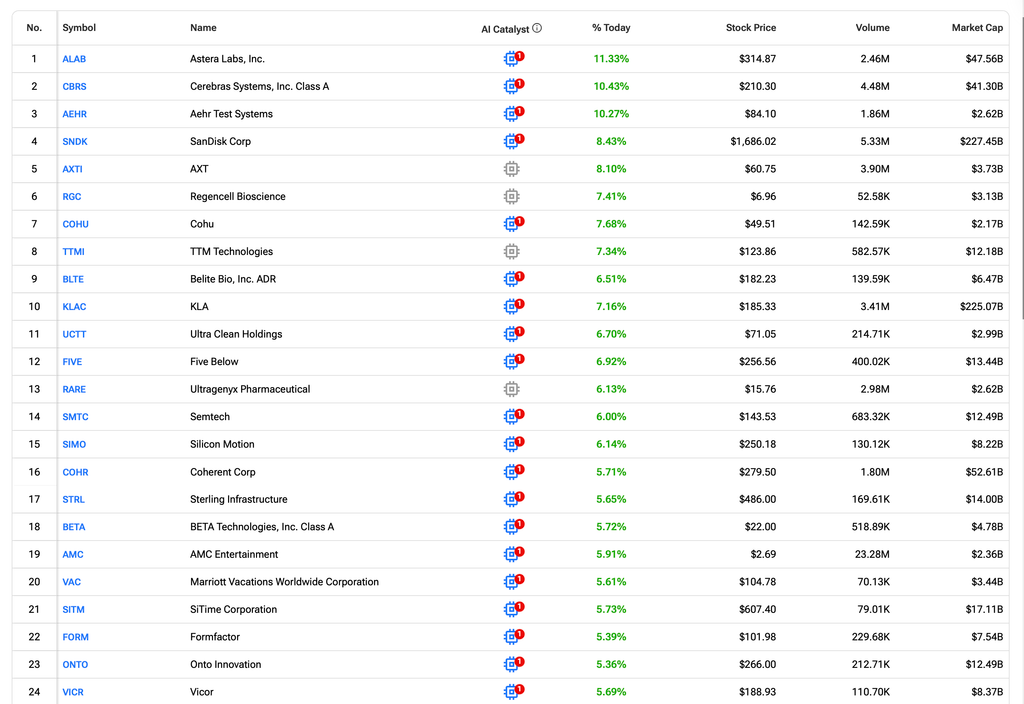
% Gainers and Decliners
Source: TipRanks
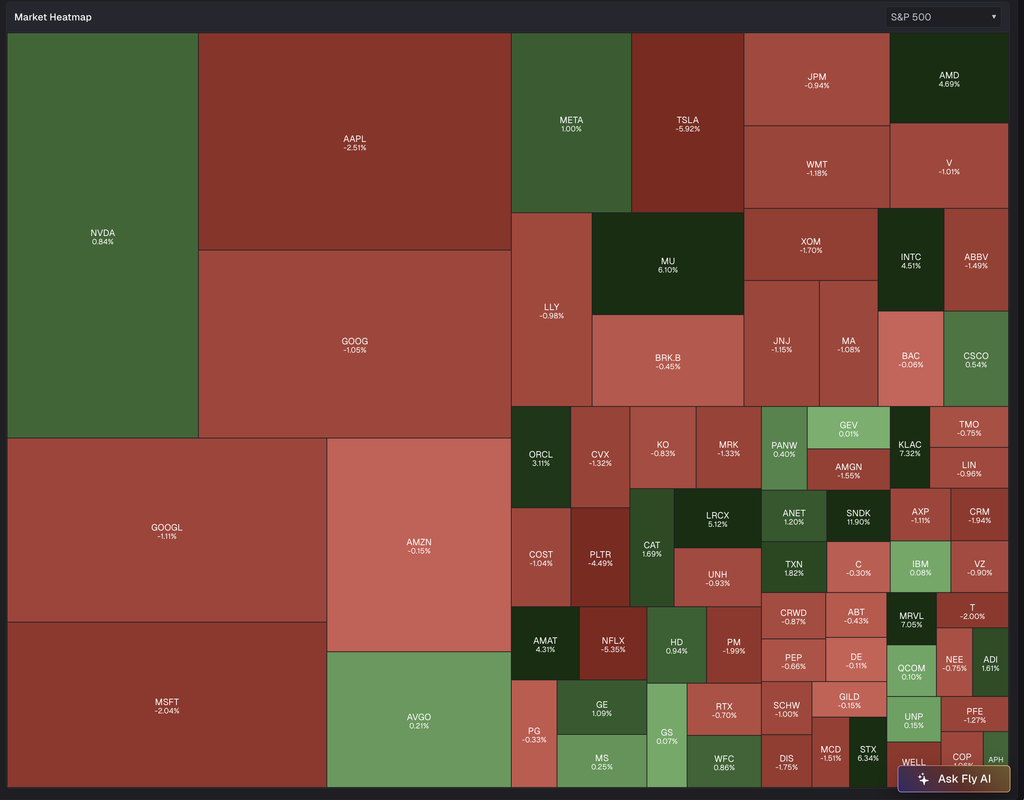
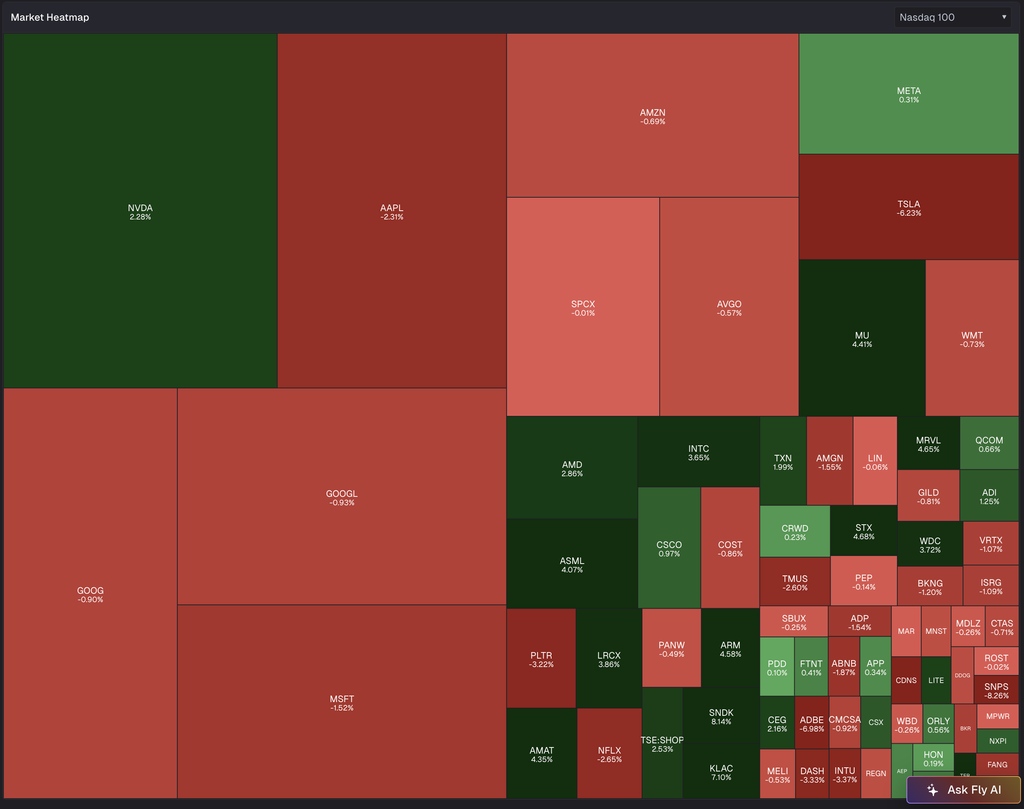
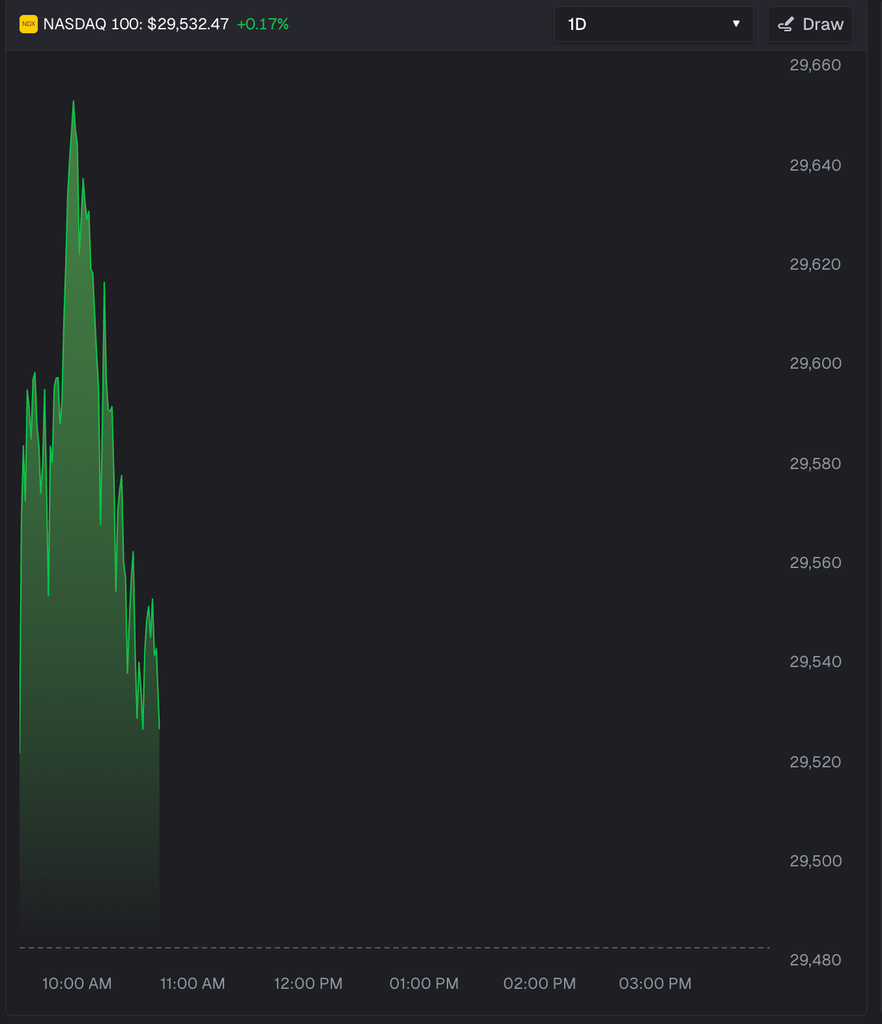
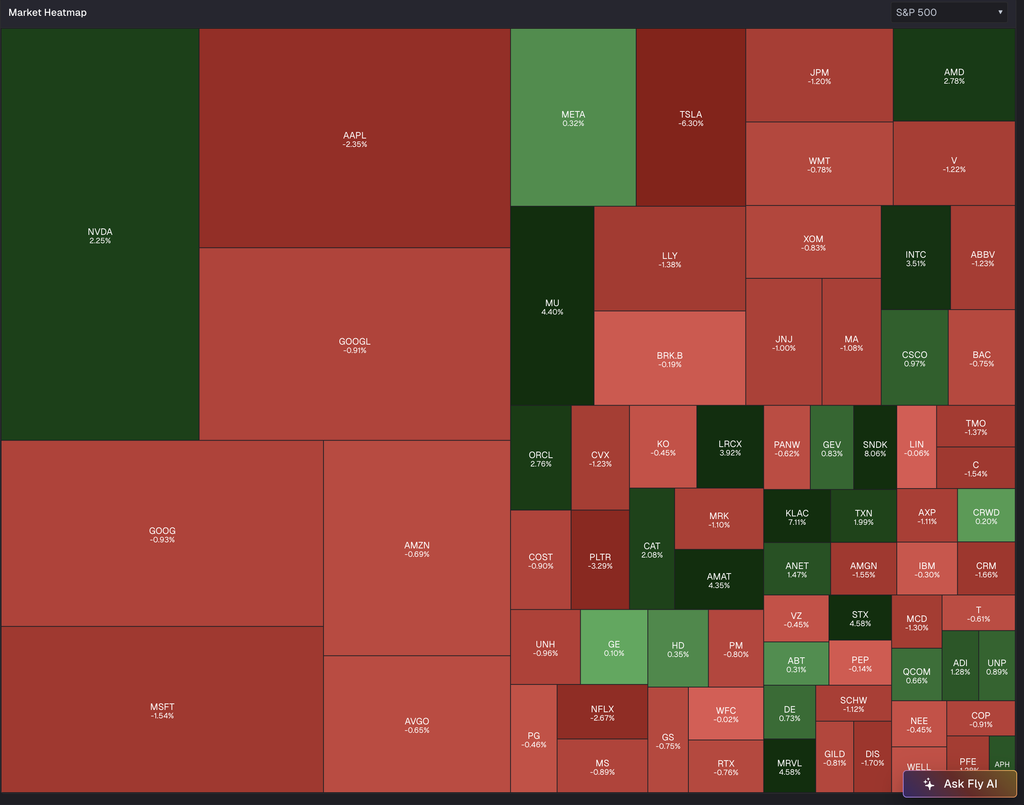
Nasdaq 100 and S&P 500 Heat Maps
Source: TheFly
Positions: None.
BY Doug Kass · Sep 4, 2026, 11:30 AM EDT
With S&P cash -40 handles I have bought back my short (SPY) calls for a profit.
I have moved from large-sized to medium-sized short SPY at $769.37.
I plan to re-short strength.
Positions: Short SPY (M)
BY Doug Kass · Sep 4, 2026, 11:20 AM EDT
I covered my (CRM) $258.54 (-$5.85) and (JPM) $356.80 (-$5.25), trading short rentals just now.
I plan to re-short strength.
Positions: None.
BY Doug Kass · Sep 4, 2026, 11:03 AM EDT
Paul Kedrosky on Dan and Guy’s Risk Reversal podcast:
Paul Kedrosky: Nvidia is the AI Bubble’s Single Point of Failure
Positions: None.
BY Doug Kass · Sep 4, 2026, 10:55 AM EDT
* They are going to get you everytime..
Short people got no reason
Short people got no reason
Short people got no reason to live
They got little hands
Little eyes
They walk around tellin’ great big lies
They got little noses
And tiny little teeth
They wear platform shoes on their nasty little feet
Dougie Kass
33m ago
My second largest trading short rental, CRM, is getting jiggy to the downside.
Dougie Kass
10m ago
My largest trading short rental, JPM, is starting to rollover.
Positions: Short CRM S JPM S
BY Doug Kass · Sep 4, 2026, 10:45 AM EDT
I will not be writing Tuesday-Thursday next week as a family member is having surgery which will require travelling to.
Positions: None.
BY Doug Kass · Sep 4, 2026, 10:27 AM EDT
BY Doug Kass · Sep 4, 2026, 10:15 AM EDT
With S&P cash -5 handles I shorted more (SPY) calls.
Position: Short SPY common L calls S
BY Doug Kass · Sep 4, 2026, 9:50 AM EDT
nsethi9999
19m ago
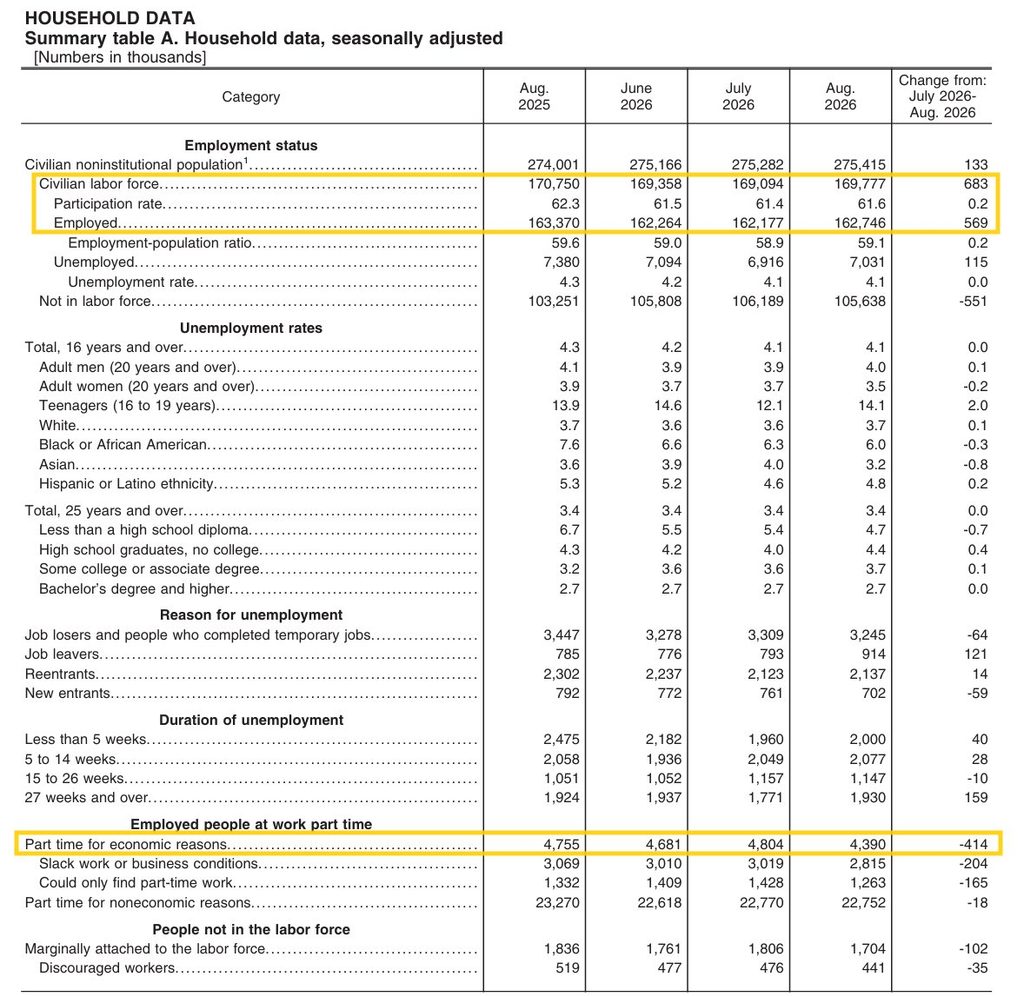
And a very strong household survey. After losing jobs in 6 of the past 7 months, household survey sees # of employed jump +569k. But the unemployment rate remains at 4.1% (4.14%) as labor force bounces +683k, bringing LF participation rate back up to 61.6% from 61.4%.
Full-time jobs +735k after four straight declines; part-time -223k. Part-time for economic reasons -414k to 4.39 million; U-6 down to 7.7%, lowest this year.
Positions: None.
BY Doug Kass · Sep 4, 2026, 9:35 AM EDT
The S&P Short Range Oscillator moved closer to neutral and stands at -0.61% v -1.86%
Positions: Short SPY common L calls S
BY Doug Kass · Sep 4, 2026, 9:17 AM EDT
Source: TipRanks
BY Doug Kass · Sep 4, 2026, 9:07 AM EDT
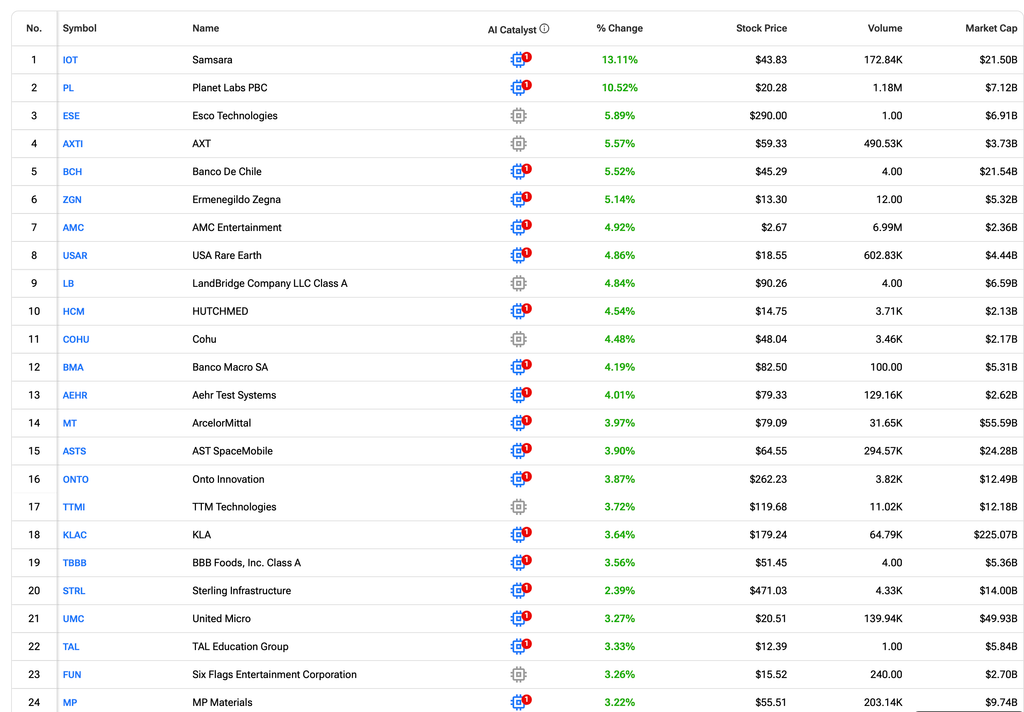
-AOUT +27% (earnings, guidance)
-IOT +13% (earnings, guidance)
-PL +11% (earnings, guidance)
-AMC +4.9% (acquires digital out-of-home media network Captivate)
-USAR +4.8% (China rare earth firms reportedly halt some US shipments over geopolitical worries)
-MP +3.4% (China rare earth firms reportedly halt some US shipments over geopolitical worries)
-BE +2.9% (momentum)
-IONS +2.8% (strength following FDA approval of Zanvastro (zilganersen) for treatment of Alexander Disease)
-TTD +2.5% (plans 15% workforce reduction)
-UUUU +2.5% (China rare earth firms reportedly halt some US shipments over geopolitical worries)
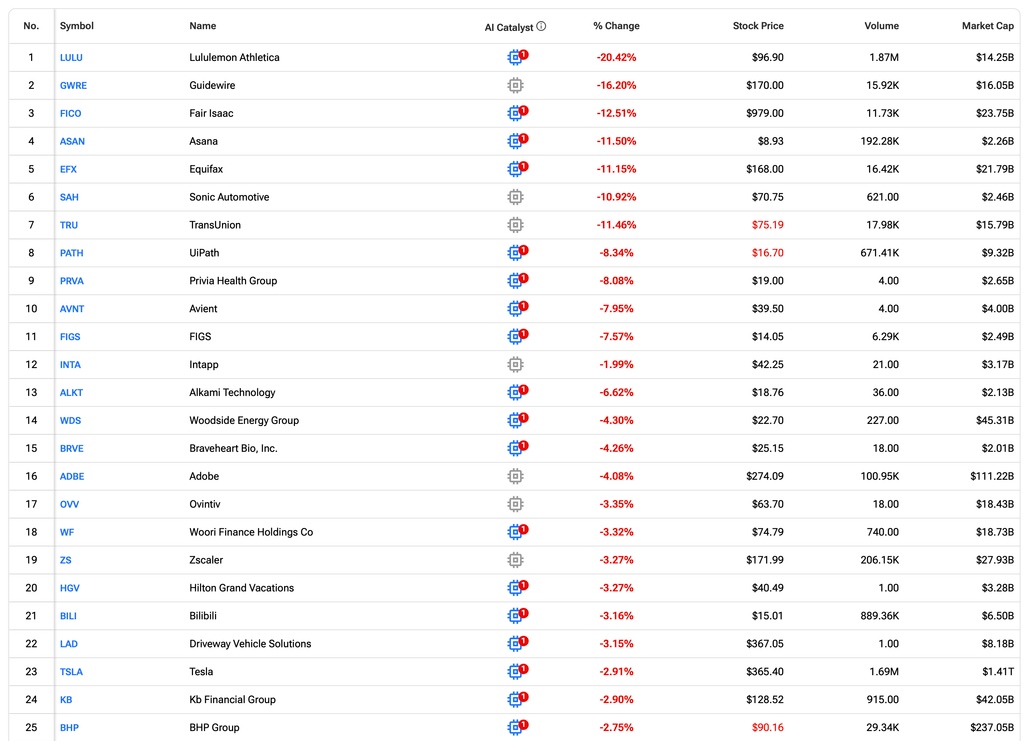
-LULU -20% (earnings, guidance)
-OXM -17% (earnings, guidance)
-GWRE -16% (earnings, guidance)
-FICO -14% (US FHFA Dir Pulte: Equifax, Experian, Transunion have been overcharging; Seriously considering bi-merge and stronger solutions)
-EFX -12% (US FHFA Dir Pulte: Equifax, Experian, Transunion have been overcharging; Seriously considering bi-merge and stronger solutions)
-TRU -12% (US FHFA Dir Pulte: Equifax, Experian, Transunion have been overcharging; Seriously considering bi-merge and stronger solutions)
-PATH -8.5% (earnings, guidance)
-ADBE -3.9% (appoints Anil Chakravarthy as CEO, effective Dc 1st)
-ZS -3.4% (earnings, guidance)
-TSLA -2.9% (weakness following underwhelming Cybercab launch)
-BILI -2.6% (files to sell $700M convertible senior unsecured notes due 2031)
BY Doug Kass · Sep 4, 2026, 9:04 AM EDT
9:40 a.m.: Fed Bank of Chicago President Goolsbee (Non-Voter) Television Appearance — FOX Business;
6:00 p.m.: Television Appearance — PBS News Hour
Source of below: TipRanks
BY Doug Kass · Sep 4, 2026, 8:59 AM EDT
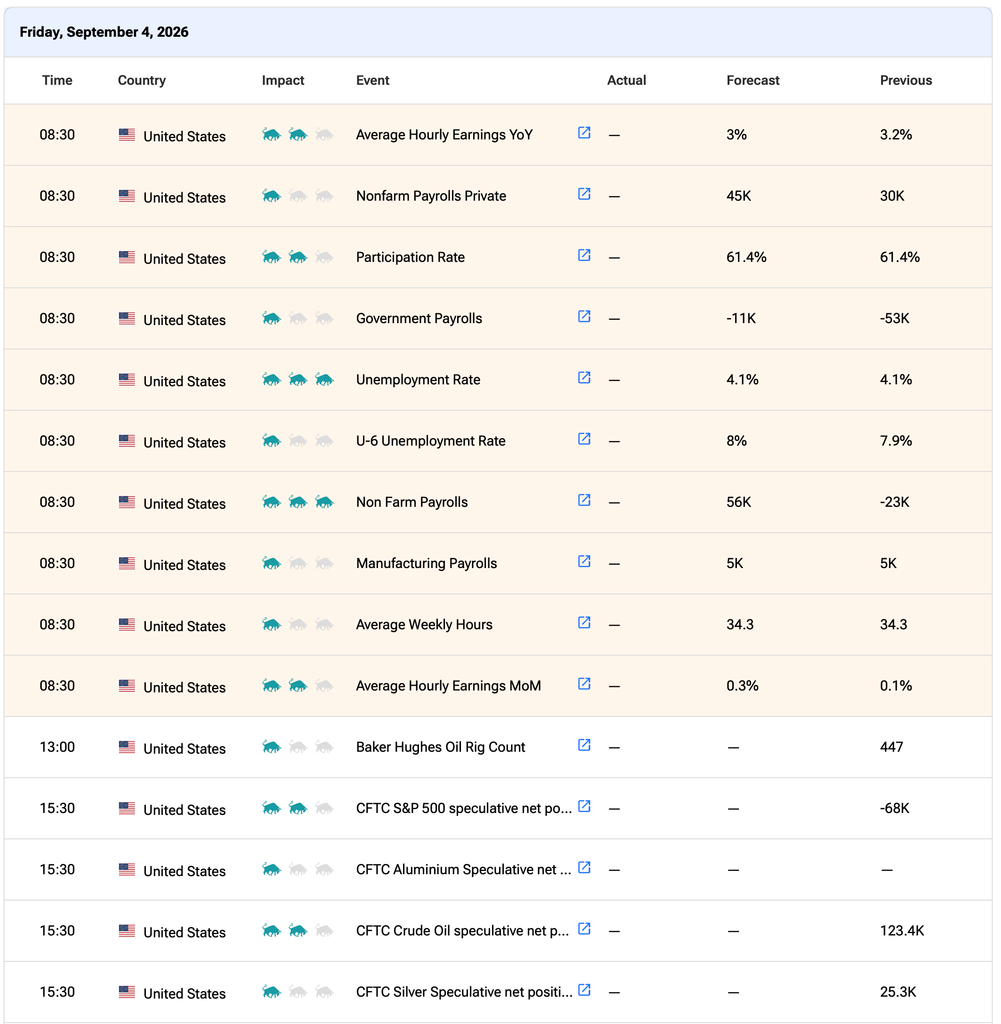
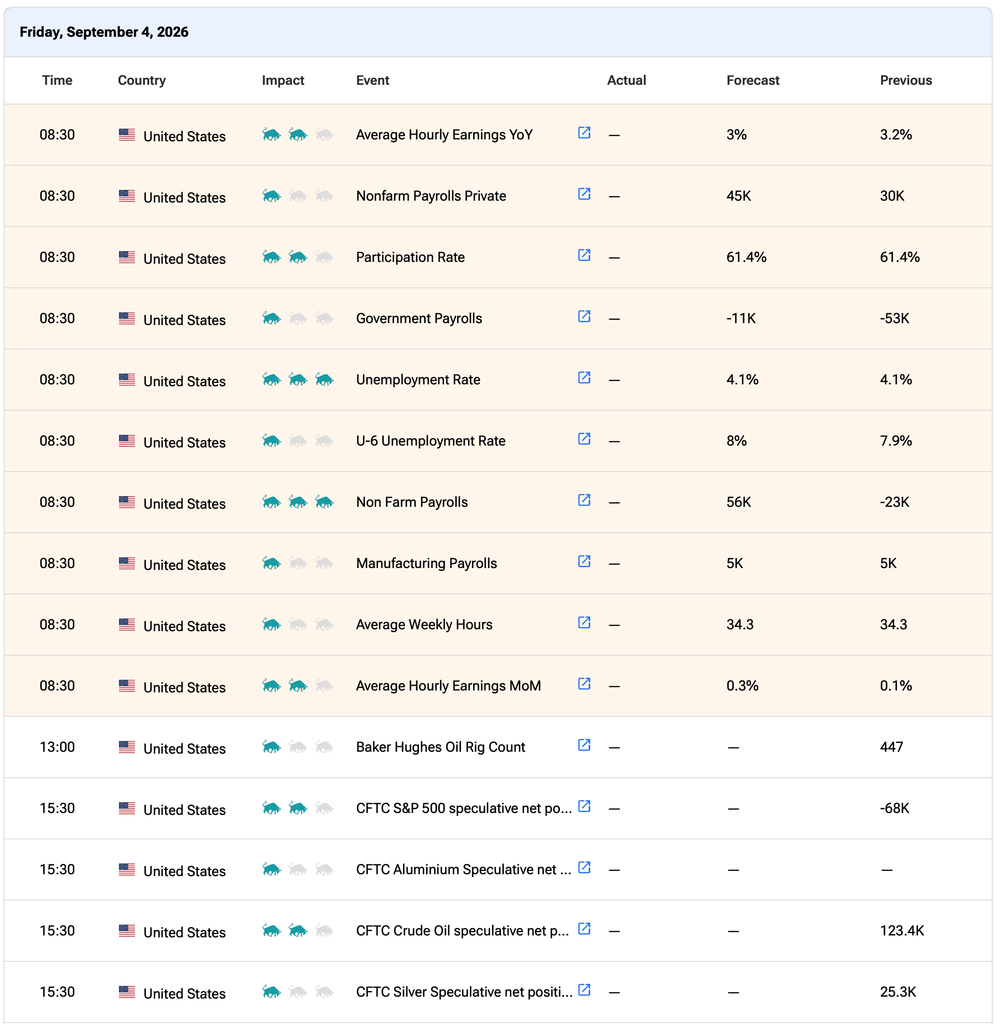
After the big non farm payroll print I feel better about having sold my gold long yesterday (GLD) is now -$9 from my sale):
Here are today’s things:
* I sold my ($GLD) long at $411.65.
BY Doug Kass · Sep 3, 2026, 3:55 PM EDT
And I feel better about my SPY shorts yesterday and today:
* At 5:05 a.m….
I added to my large (SPY) short at $773.88.
Positions: Short SPY common L and calls S
BY Doug Kass · Sep 4, 2026, 7:45 AM EDT
Short SPY common L and calls S
BY Doug Kass · Sep 4, 2026, 8:43 AM EDT
Positions: None.
BY Doug Kass · Sep 4, 2026, 8:25 AM EDT
Position: Short BX VS
BY Doug Kass · Sep 4, 2026, 8:06 AM EDT
Funding our growing deficit and debt is becoming more problematic:
Positions: None.
BY Doug Kass · Sep 4, 2026, 7:59 AM EDT
Positions: None.
BY Doug Kass · Sep 4, 2026, 7:50 AM EDT
* At 5:05 a.m….
I added to my large (SPY) short at $773.88.
Positions: Short SPY common L and calls S
BY Doug Kass · Sep 4, 2026, 7:45 AM EDT
Positions: None.
BY Doug Kass · Sep 4, 2026, 7:39 AM EDT
Positions: None.
BY Doug Kass · Sep 4, 2026, 7:37 AM EDT
World's biggest sovereign wealth fund plans to cut U.S. Treasury holdings cnbc.com/2026/09/04/wor…
🇺🇸 The share of corporate output going to workers fell to 52.8% in the second quarter, the lowest level since the series began in 1947 ⚠. That number partly explains why US corporate profits remain so strong. ➡️ The labor share is the share of output that goes to workers Show more

The dominoes are falling Breaking: Blackstone just restricted withdrawals from its $77 billion private credit fund for the second consecutive quarter They have only returned 50% of investors request Companies capping withdrawals: • Blackstone • Blue Owl Capital • Apollo Show more

🇺🇸 S&P 500 With the CAPE ratio now above 40, the setup for the next decade looks grim. In past episodes at the current level, US equities went on to deliver negative real returns, averaging roughly −2.6% a year 👉 isabelnet.com/?s=S%26P+500 h/t @LanceRoberts #spx #stocks $spx


