Is Buffett Adding Fuel to Occidental's Next Move?
As Berkshire Hathaway continues to add to Occidental, let's see where the charts are heading.
You've reached your free article limit
You've read 0 of 1 free Pro articles.
Warren Buffett's Berkshire Hathaway BRK.B accumulated more shares of Occidental Petroleum OXY. Berkshire's stake is now near 29% of the shares of the global energy giant.
Let's review the charts and indicators.
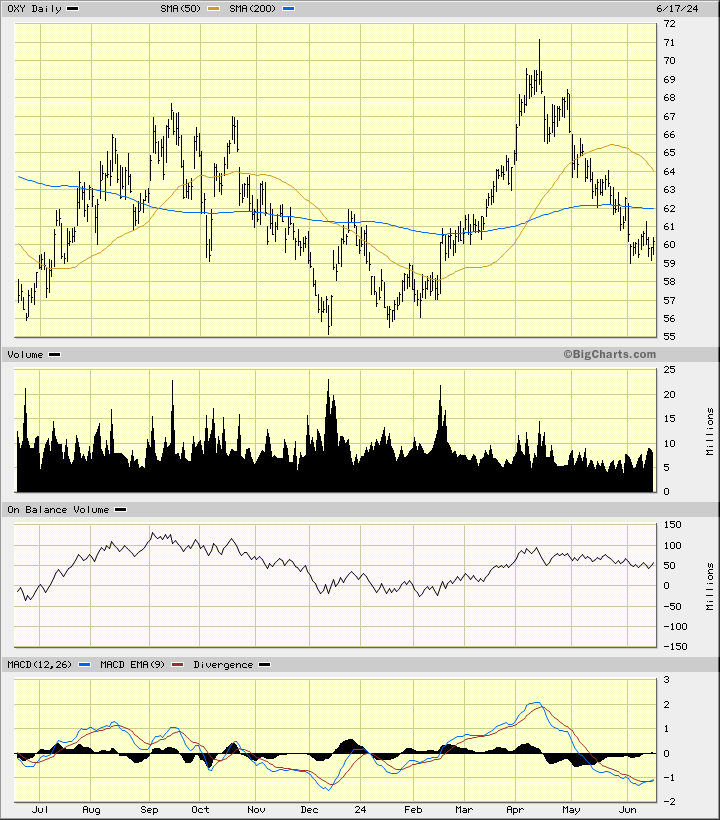
In this daily bar chart of OXY, below, I can see that prices have corrected lower the past two months. OXY trades below the declining 50-day moving average line and below the cresting 200-day line. Trading volume has been subdued the past three months, while the On-Balance-Volume (OBV) line has slipped lower over the same time frame. The Moving Average Convergence Divergence (MACD) oscillator is well below the zero-line but trying to turn higher for a cover-shorts buy signal.
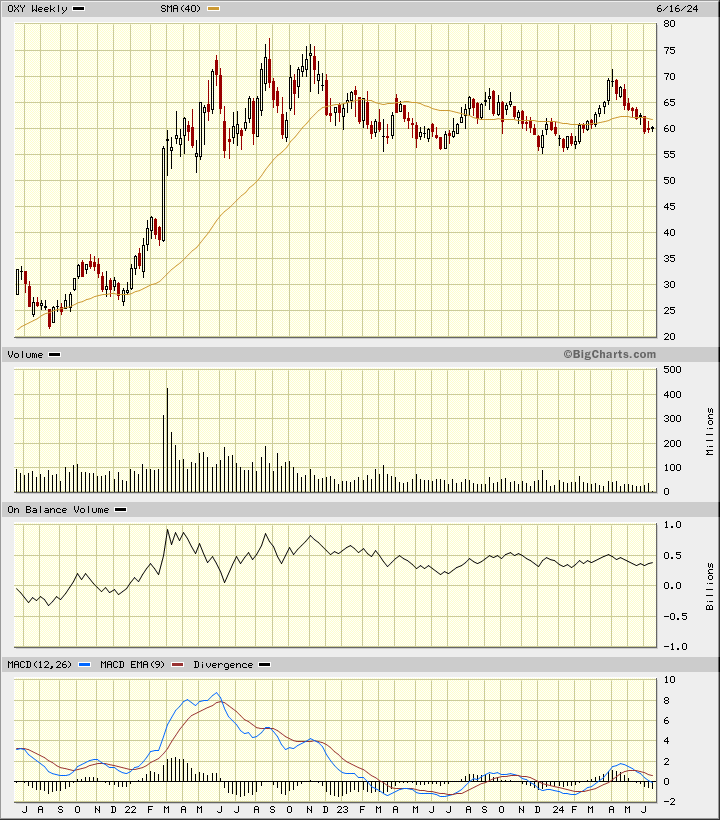
In this weekly Japanese candlestick chart of OXY, below, I can see that prices have traded sideways the past two years. Prices trade below the cresting 40-week moving average line. The OBV line shows a slow decline the past two-and-a-half years. The moving average convergence divergence oscillator is pointed down and testing the zero-line. The zero-line has been a "magnet" for the oscillator the past year.
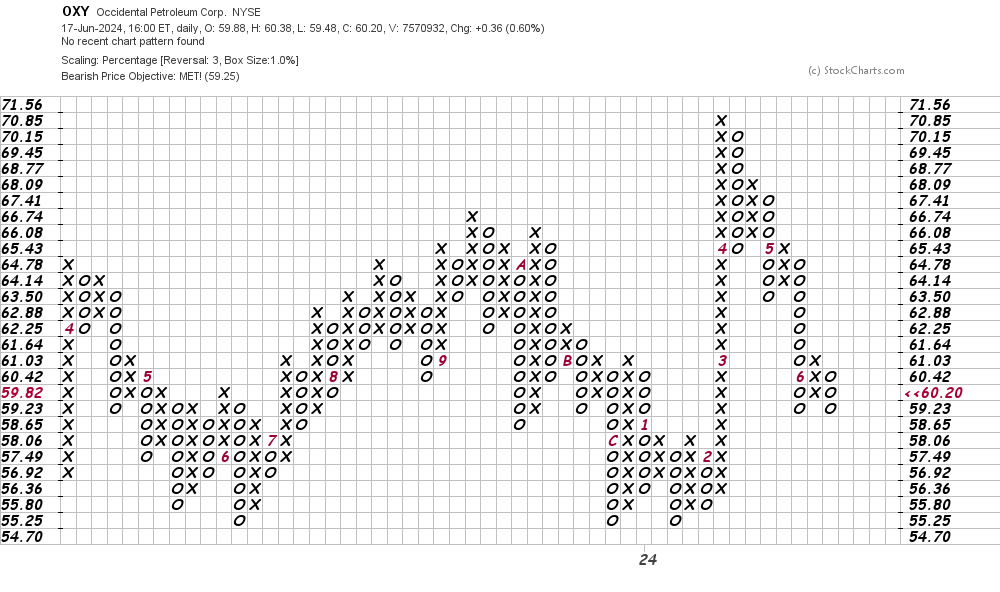
In this daily Point and Figure chart of OXY, below, I can see the recent decline and that prices have reached a downside price target in the $59 area.
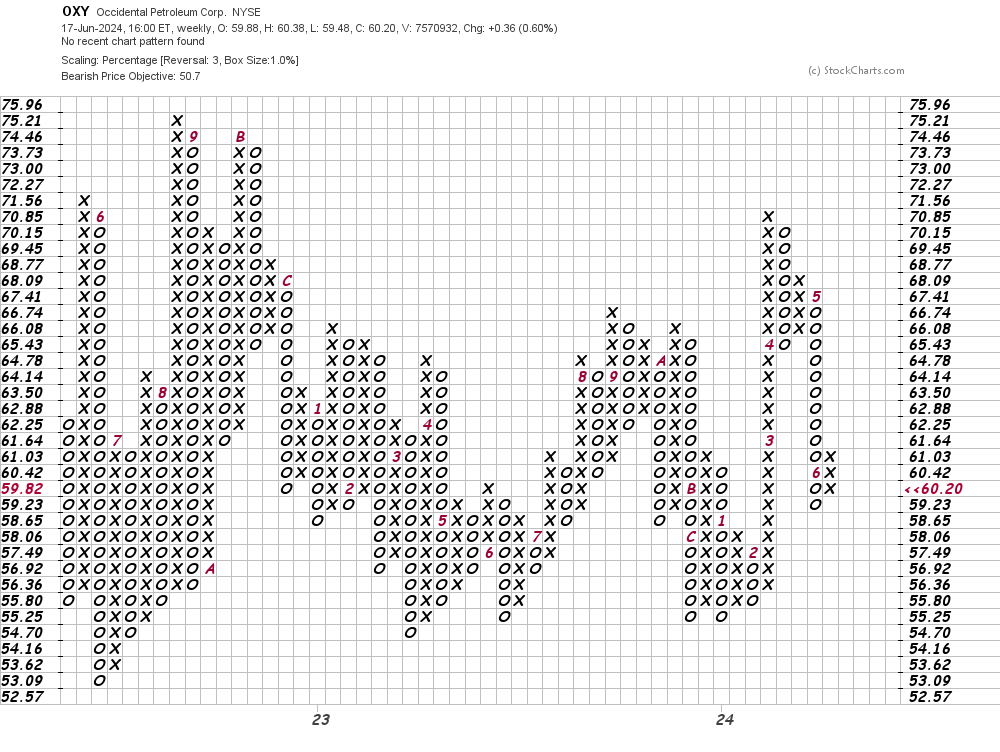
In this weekly Point and Figure chart of OXY, below, I can see that the software is projecting a price target in the $51 area.
Bottom line strategy: I wonder where OXY would be trading today if Buffett was not a significant buyer. OXY needs to build a new base pattern unless crude oil futures rally significantly.
Employees of TheStreet are prohibited from trading individual securities.