When Will Walgreens Stock Rise Again?
Let's see where things may be headed.
You've reached your free article limit
You've read 0 of 1 free Pro articles.
Drugstore chain Walgreens Boots Alliance WBA has been in a longer-term downtrend. Is there light at the end of the tunnel or are further declines in the cards?
Let's check out the charts and indicators to see where things may be headed.
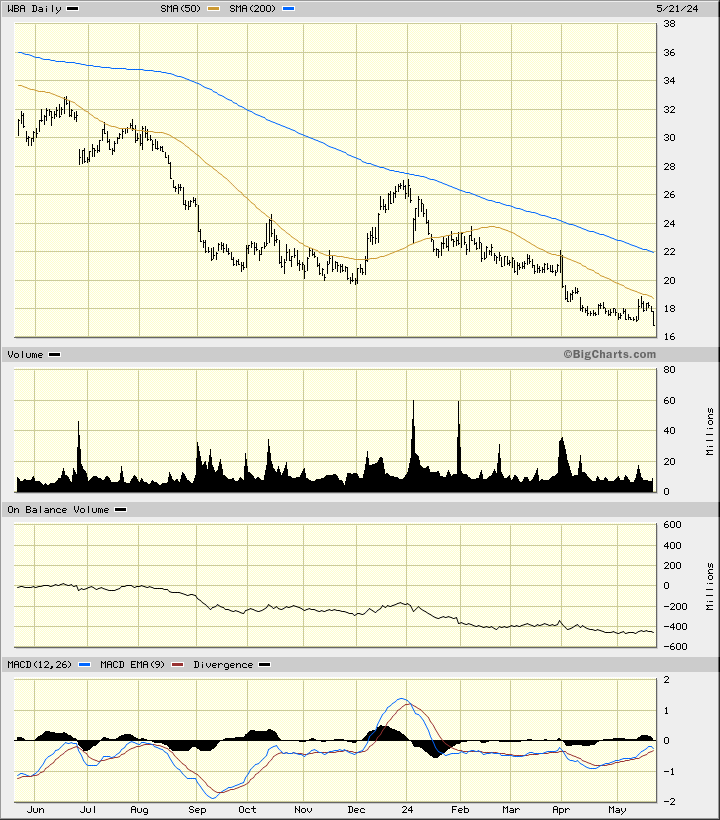
In this daily bar chart of WBA, below, I can see that prices have tumbled lower and lower the past year. Prices trade below the bearish 50-day moving average line and below the bearish 200-day moving average line. The trading volume looks like it has been more active since the beginning of the year and tells me that traders are voting with their feet and selling.
The On-Balance-Volume (OBV) line has been in a glide path lower the past year. The Moving Average Convergence Divergence (MACD) oscillator shows some improvement since the middle of April but it remains below the zero line.
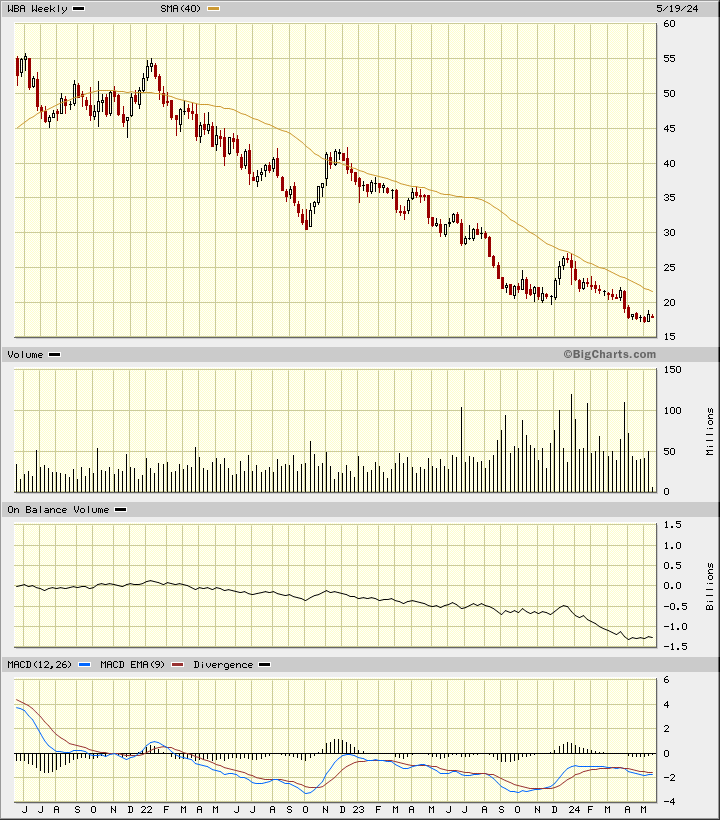
In this weekly Japanese candlestick chart of WBA, below, I can see a durable downtrend in the past three years. Prices have rallied to the underside of the declining 40-week moving average line a number of times and failed.
The weekly OBV line has a downward slope over the past three years. The MACD oscillator has been below the zero line for much of the last three years.
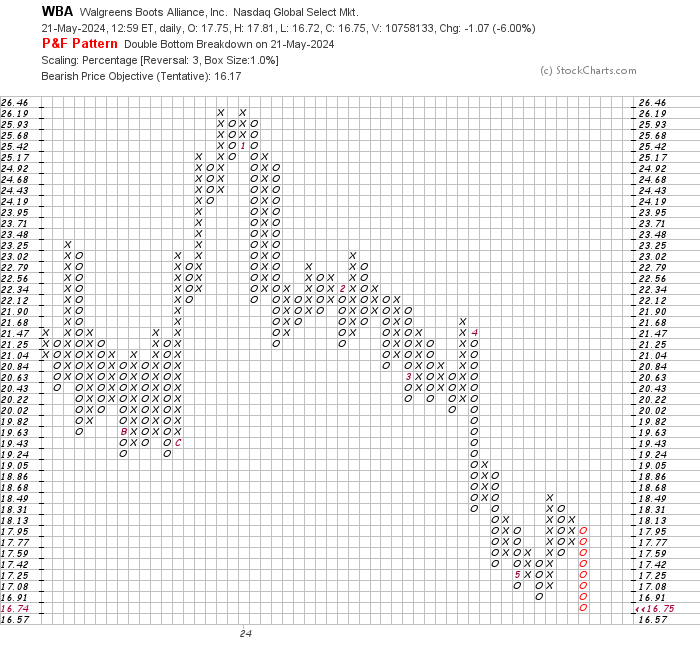
In this daily Point and Figure chart of WBA, below, I can see a downside price target in the $16 area.
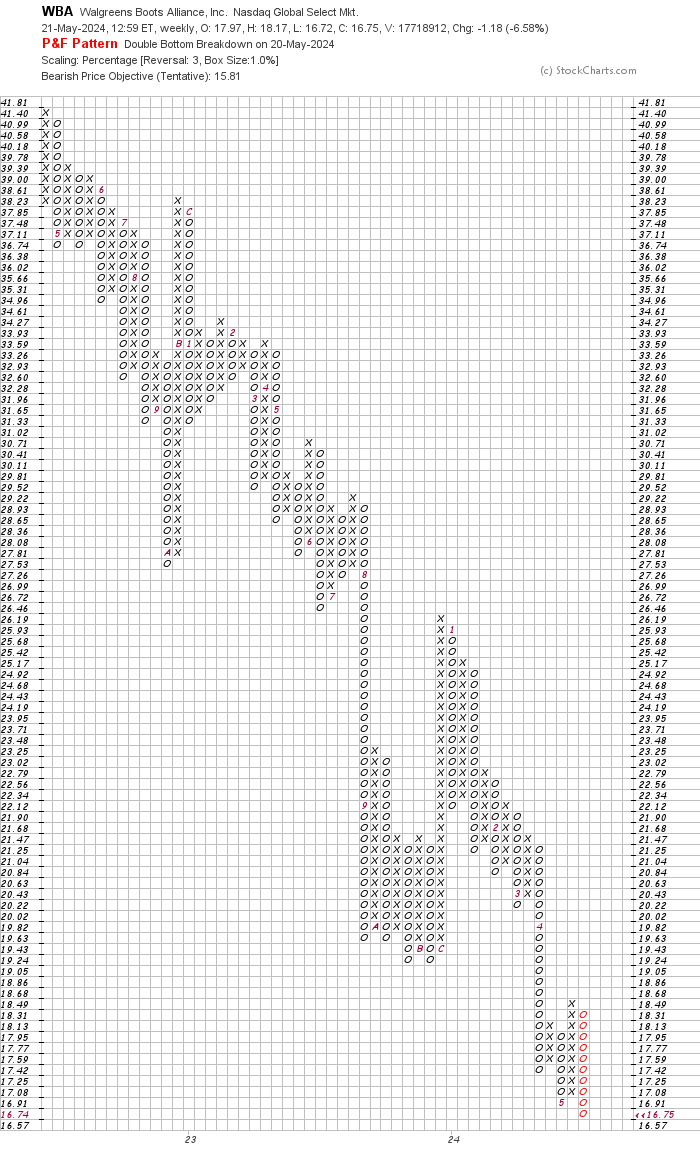
In this first weekly Point and Figure chart of WBA, below, I can see a price target just below $16.
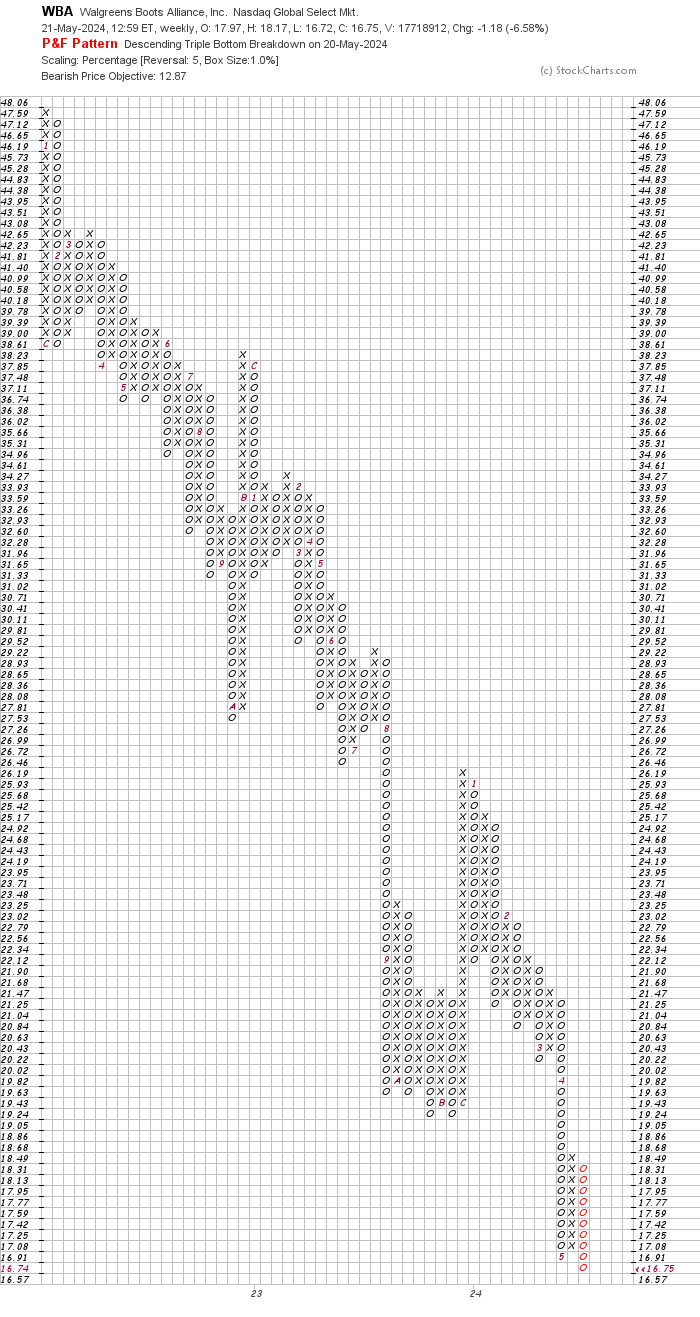
In this second weekly Point and Figure chart of WBA, below, I used a five box reversal filter. Here the software suggests a price target in the $13 area.
Bottom line strategy: Trends are real and they can persist. The persistent trend in WBA has been down. No bottom has begun to form so further declines are possible. Avoid the long side of WBA.
Employees of TheStreet are prohibited from trading individual securities.