We Got a Little Pullback. Here's What to Watch for if the Market Rallies Again.
Let's look at the indicators to see what could happen next.
You've reached your free article limit
You've read 0 of 1 free Pro articles.

The Market
So, we got a little pullback—a little trip to the basement. The time has come, though, to talk about what we should look for should I be correct and the market rallies again after this pullback.
So far, we have seen very little interest in buying—ex stocks that gap up on earnings—much outside of tech, and even within tech, it’s been pretty narrow. So here’s what I will watch should we get another rally (as I expect).
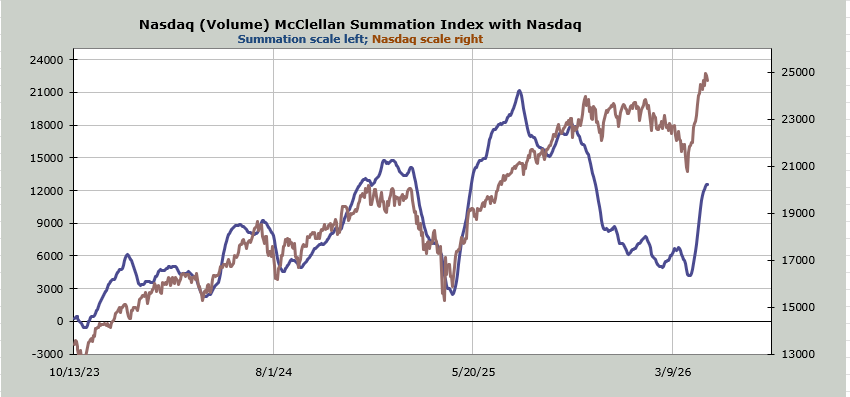
The Nasdaq McClellan Summation Index stopped going up today. That is the first time since March 26th. Let’s call it a month. As a reminder, I use the volume for Nasdaq. It won’t take a lot to get it heading back up, but it’s enough. +1.9 billion shares will do it. So that’s on my radar.
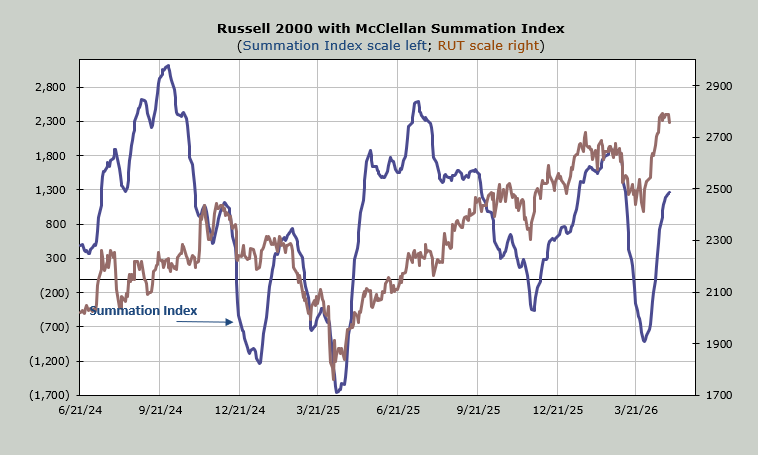
Down below is the NYSE Summation Index. Here it is still heading up (barely), so it still needs a net differential of -300 advancers minus decliners on the NYSE to halt the rise. So the lagging breadth becomes important in the next week or so.
The number of stocks making new highs continues to lag as well. As I have noted the last few days, I will watch for a rise in stocks making new lows. It did not rise today, however, over on Nasdaq the new highs have contracted so much that there were only ten more new highs than new lows. So, I will watch for an expansion in new lows and/or new highs get so low that it flips from more new highs than lows to more new lows than highs.
We already have the sentiment in terms of the put/call ratios showing excessive bullishness. Tomorrow we will get the Investors Intelligence survey, where last week was at 49% bulls. I do not expect another big jump in bulls, but if they should jump over 55%, I’d get concerned.
The Dow has been red for four straight days, so my guess is we see it get some love before the week is out. Tomorrow is Fed Day, so I call it a coin toss, but my expectation would be that if we get some more pulling back this week, we have another rally attempt next week. And we watch the indicators to see if they roll over or not.
New Ideas
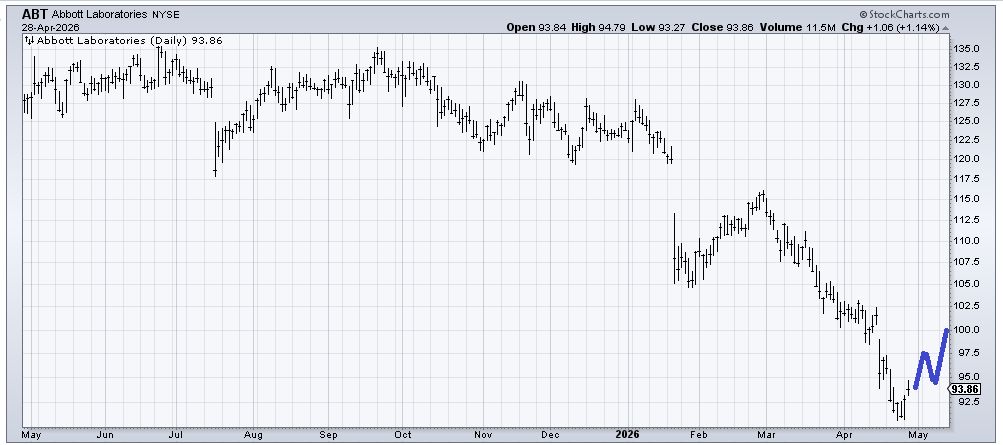
I want to follow up with the person who asked about Abbott Labs (ABT) a week or so ago. It has bounced, without much oomph. So, I want to draw in how it might develop, how it might become a better chart. Please keep in mind it’s not so much the price that I’m watching but the pattern. If it can start to play out like this, then I would say it should begin to finally begin improving.
Today’s Indicator
The McClellan Summation Index is discussed above.
Q&A/Reader’s Feedback
Helene welcomes your questions about Top Stocks and her charting strategy and techniques. Please send an email directly to Helene with your questions. However, please remember that TheStreet.com Top Stocks is not intended to provide personalized investment advice. Email Helene here.
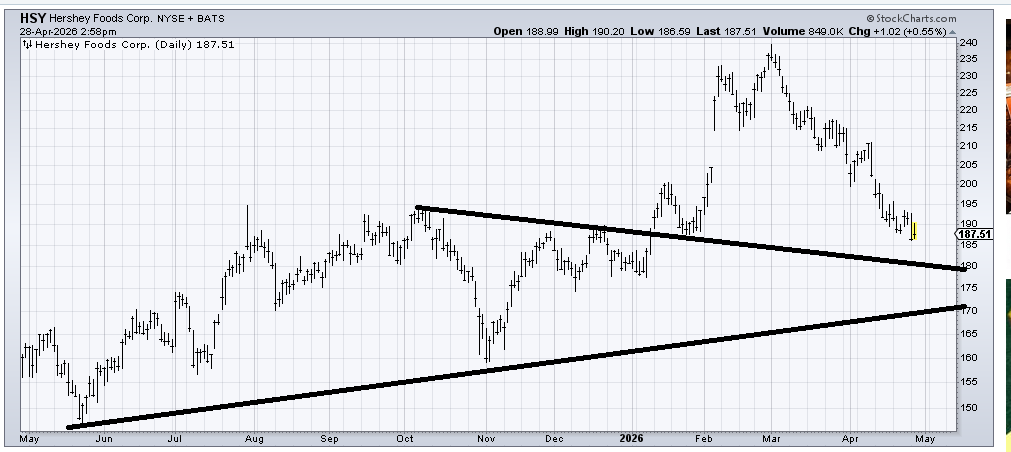
Hershey (HSY) is into support, but I’m not yet ready to trust it to do more than bounce. Perhaps if it has a spike down to that 170-180 area, I would think it is oversold enough and down enough to have a better bounce. Earnings are out Thursday, so put this view in pencil, not pen.
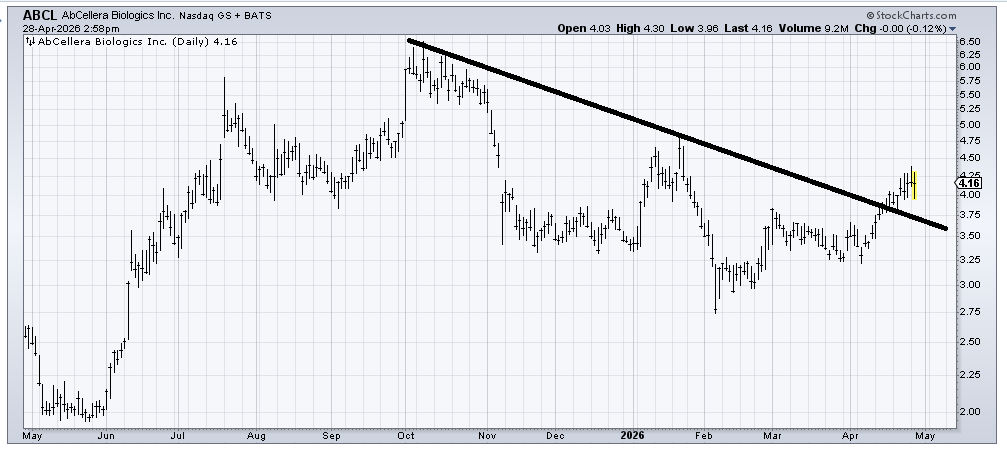
With the caveat that AbCetera Biologics ($ABCL) is a very thinly traded stock (they can tend to move more than you expect), this feels as if it is working on a base. I would not want to see it trade much under 3.25, though. If it can stay over 3.25 for a few more months, this could look better (that action on the left side of the chart would fall off, changing the look)
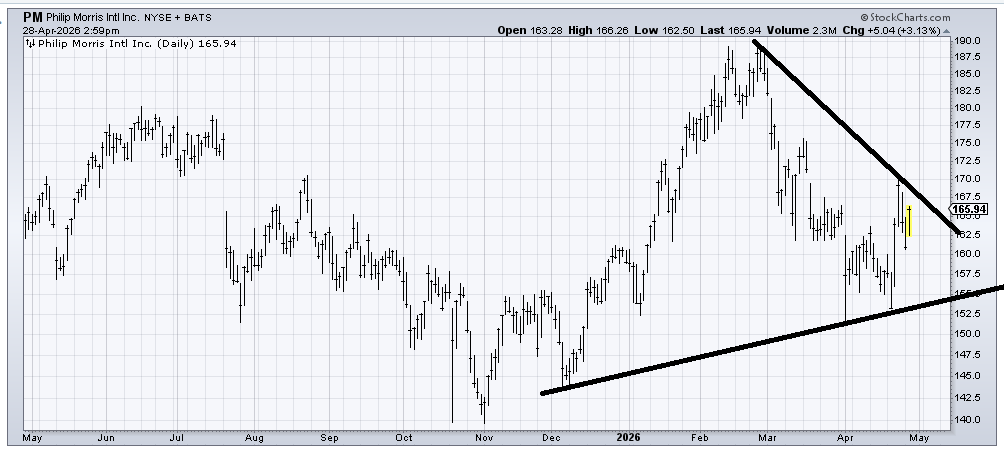
I was asked to follow up on Philip Morris (PM) , which I liked for a trade last week. I would stick with the view that if it can get up and over that 170-ish area, it improves the chart. I’m inclined to think it improves. Back under 160 and I will be wrong.
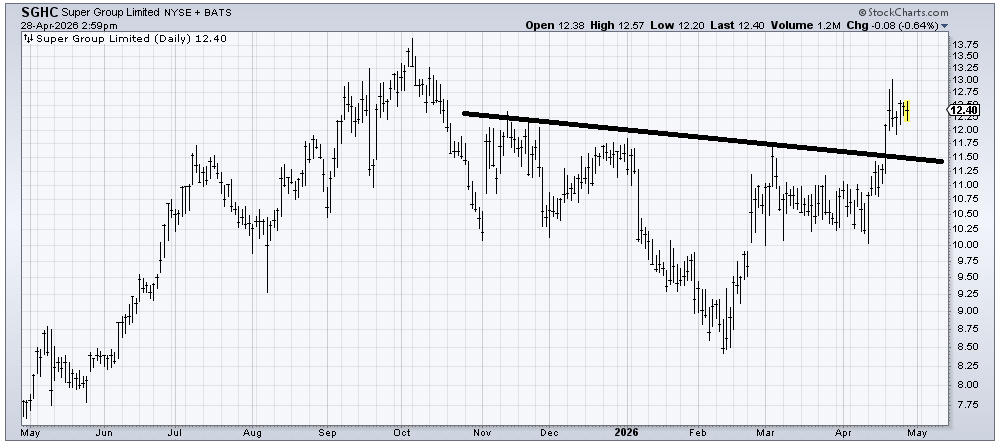
I am drawn to the chart of Super Group ($SGHC) because it looks like it broke out of a head and shoulders bottom. It has run into resistance from last fall’s high, so it might take some time to work through that, but as long as it stays over 11-ish, I’m willing to give it a chance.
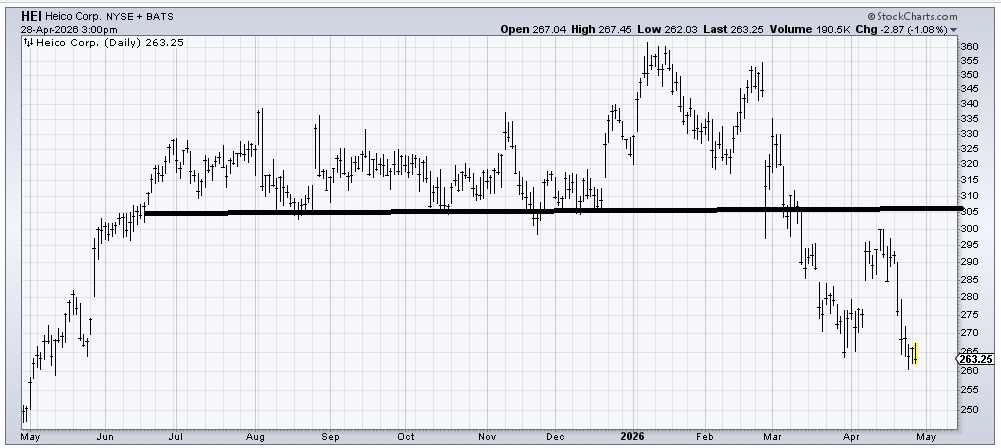
Heico (HEI) has a measured target in the 250-260 area, so it really ought to start trying to hold in this area. I’d keep my eye on it to see if it can develop.
Related: Palantir Gets New Price Target After Cleveland-Cliffs Announcement
