UiPath Stock Plunges and the Charts Are Damaged
The company cut its fiscal outlook for 2025 as a former CEO returns.
You've reached your free article limit
You've read 0 of 1 free Pro articles.
UiPath Inc. PATH develops software to automate repetitive digital tasks normally performed by people. The company announced the departure of the CEO Rob Enslin and weak guidance when they reported their latest earnings numbers last night. The stock is down sharply in early trading. Let's check out the charts and indicators.
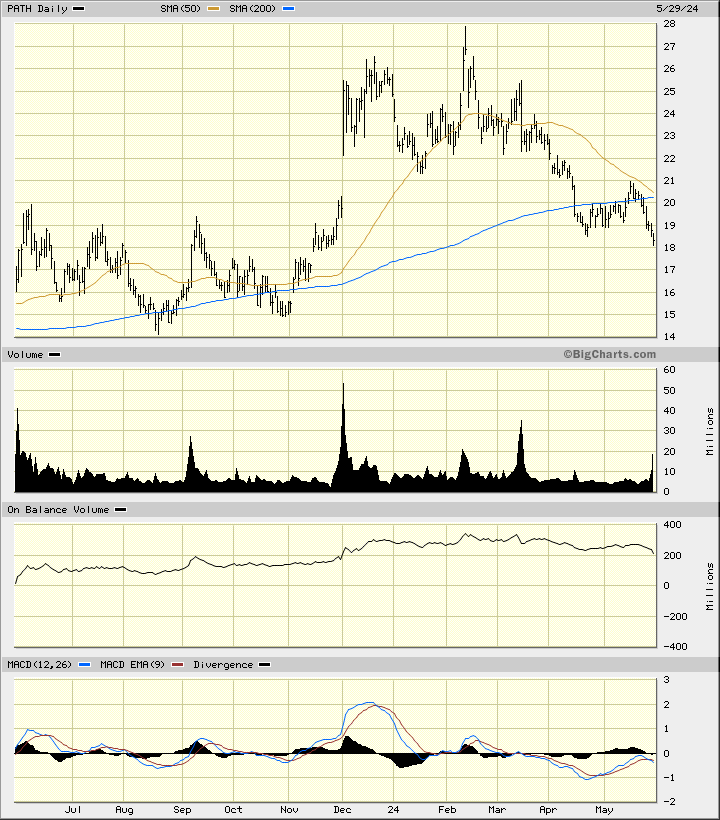
In this daily bar chart of PATH, below, I can see that prices have been weak since February. We need to use our imaginations early in the day to "see" that prices are trading in the $12.85 area which is off the bottom of this chart. Prices are below the declining 50-day moving average line.
The slope of the 200-day line is cresting. The On-Balance-Volume (OBV) line shows weakness since February. The trend-following Moving Average Convergence Divergence (MACD) oscillator has turned lower from below the zero line for a fresh outright sell signal.
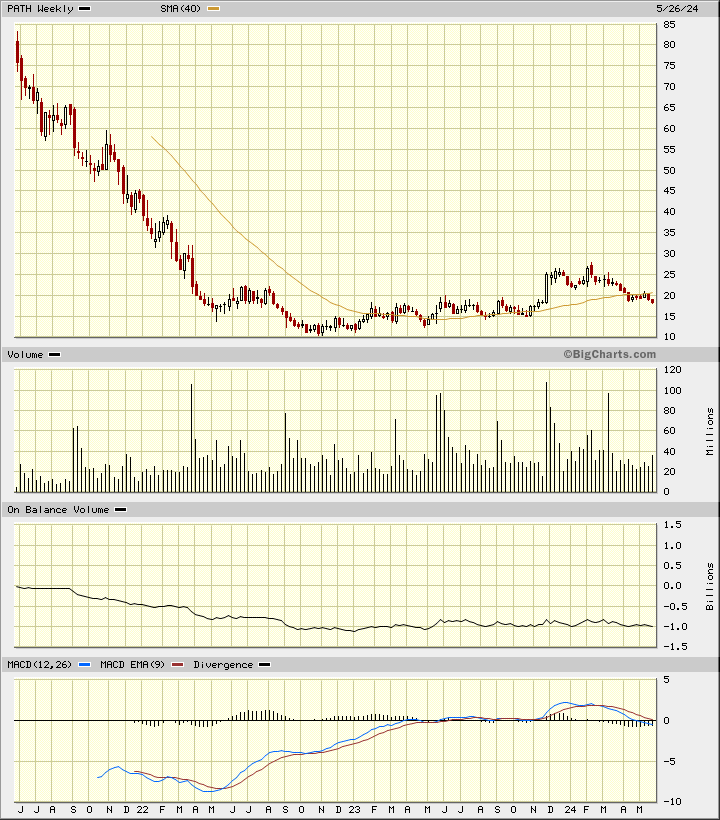
In this weekly Japanese candlestick chart of PATH, below, we can imagine prices retesting the lows of 2022. Prices were already trading below the 40-week moving average line. The weekly OBV line was weak and the MACD oscillator was bearish.
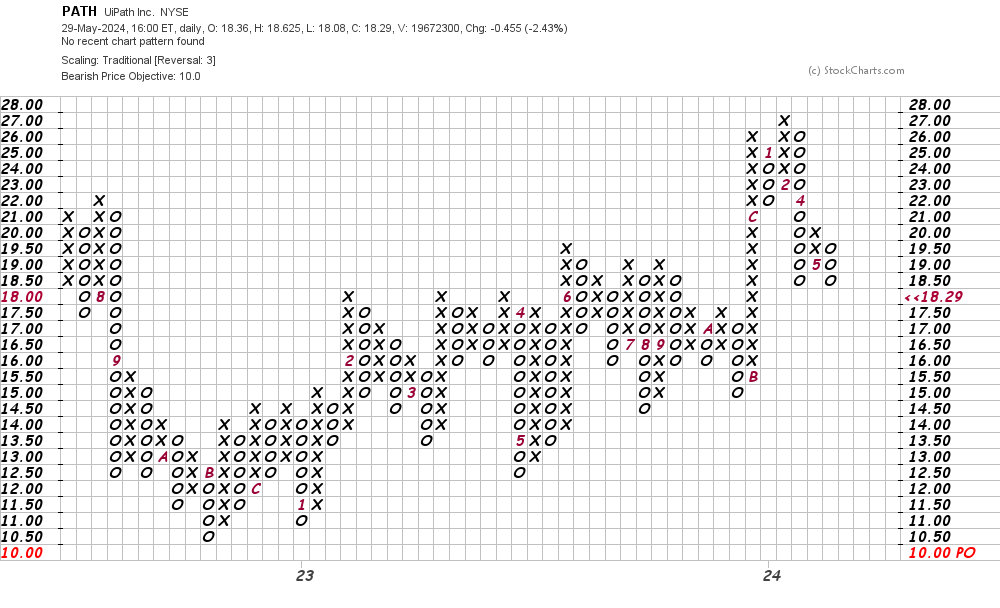
In this daily Point and Figure chart of PATH, below, I can see that the software is projecting a downside price target in the $10 area. Maybe the target will be lower when this chart is updated. We'll see.
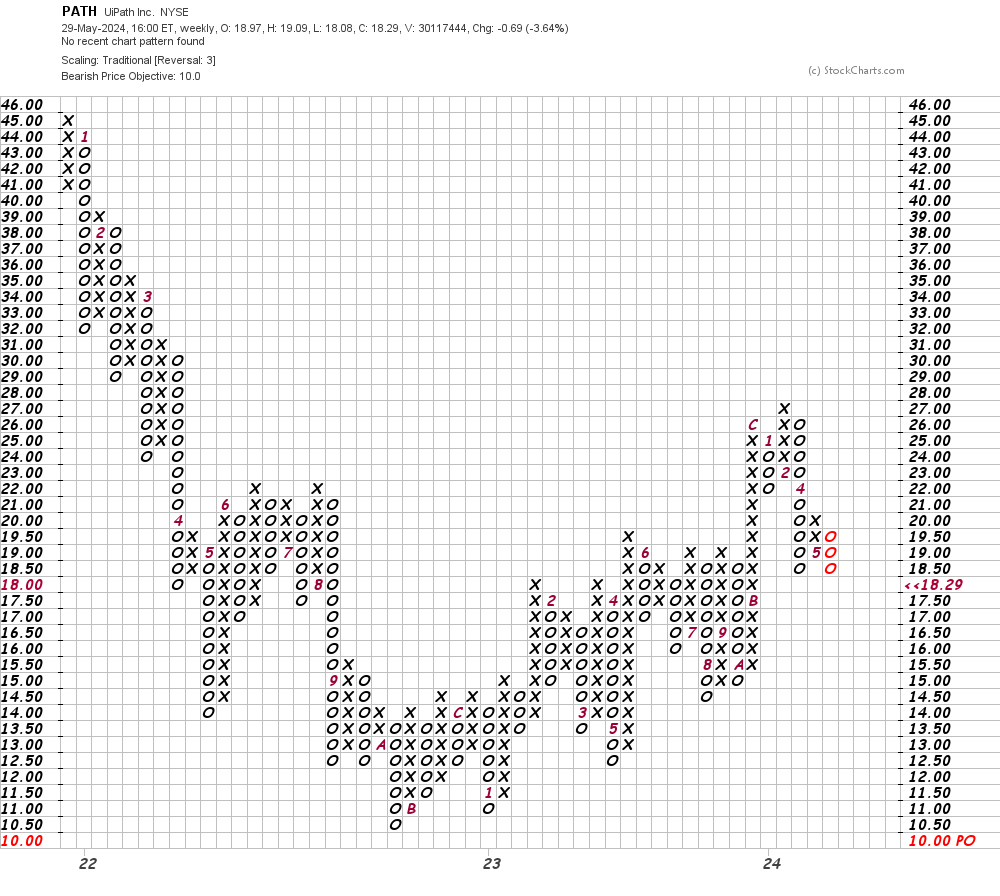
In this weekly Point and Figure chart of PATH, below, I can see the same $10 price target.
Bottom line strategy: Shares of PATH are expected to fall sharply lower. This kind of damage on the charts will take a long time to repair. Avoid the long side of PATH.
Employees of TheStreet are prohibited from trading individual securities.