This Under-the-Radar Precious Metals Play Has My Attention
Let's examine a promising low-priced Canadian name you may not have heard of before.
You've reached your free article limit
You've read 0 of 1 free Pro articles.
If you follow me on TheStreet Pro (and you should!) you know I've discussed gold, silver and other precious metals stocks a lot this year — some well-known and some a little "off the grid."
Skeena Resources Ltd. SKE explores for and develops mineral properties in Canada, including gold, silver, copper, and other precious metal deposits.
The stock has made a good start at a base pattern, so let's explore the ins and outs of the charts.
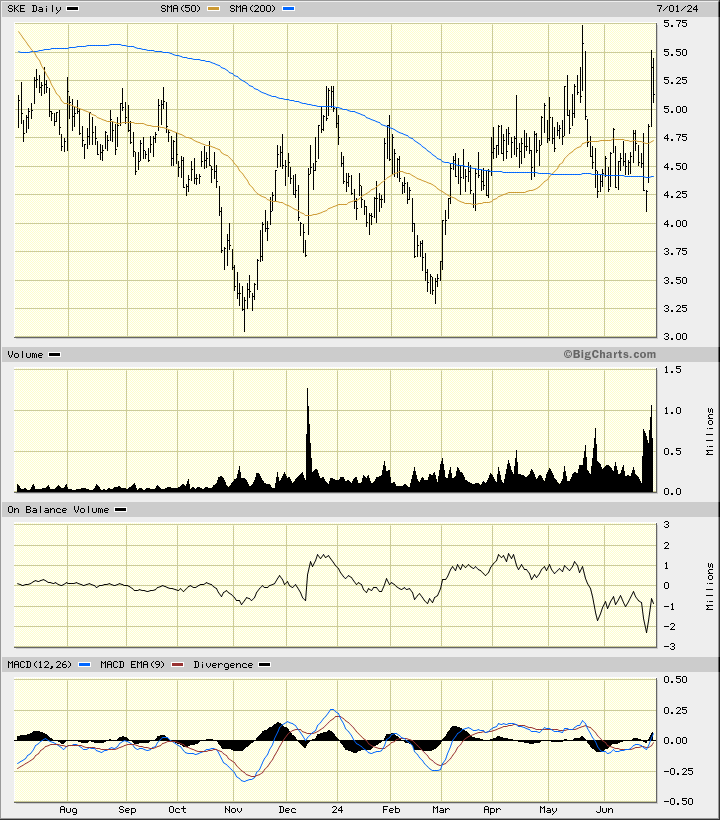
In the daily bar chart of SKE, below, I can see a very choppy trading pattern. Prices have moved sharply higher and lower in short periods of time. This kind of price action is not uncommon for low-priced stocks and not unusual for natural resource plays. Prices have moved around the 50-day moving average line and the slower-to-react 200-day moving average line.
The daily trading volume has increased since October. The On-Balance-Volume (OBV) line has moved in an uneven decline since early April. The Moving Average Convergence Divergence (MACD) oscillator has moved around the zero line this past year but is currently moving above it.
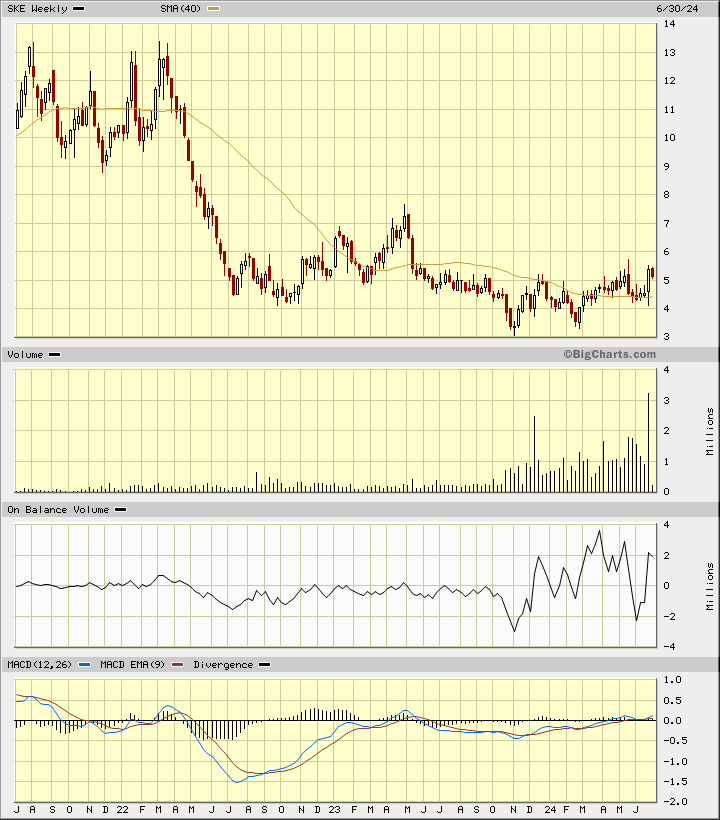
In the weekly Japanese candlestick chart of SKE, below, I see a mixed picture. Prices show a decline and some basing action but I think the pattern needs more development (a.k.a. buying or accumulation). The top of this potential base pattern is the $7.50 area and that needs to be cleared for a breakout from the base.
The trading volume has increased since November and that is a positive. The On-Balance-Volume (OBV) line has made some wide swings up and down since November. The MACD oscillator is slightly above the zero line.
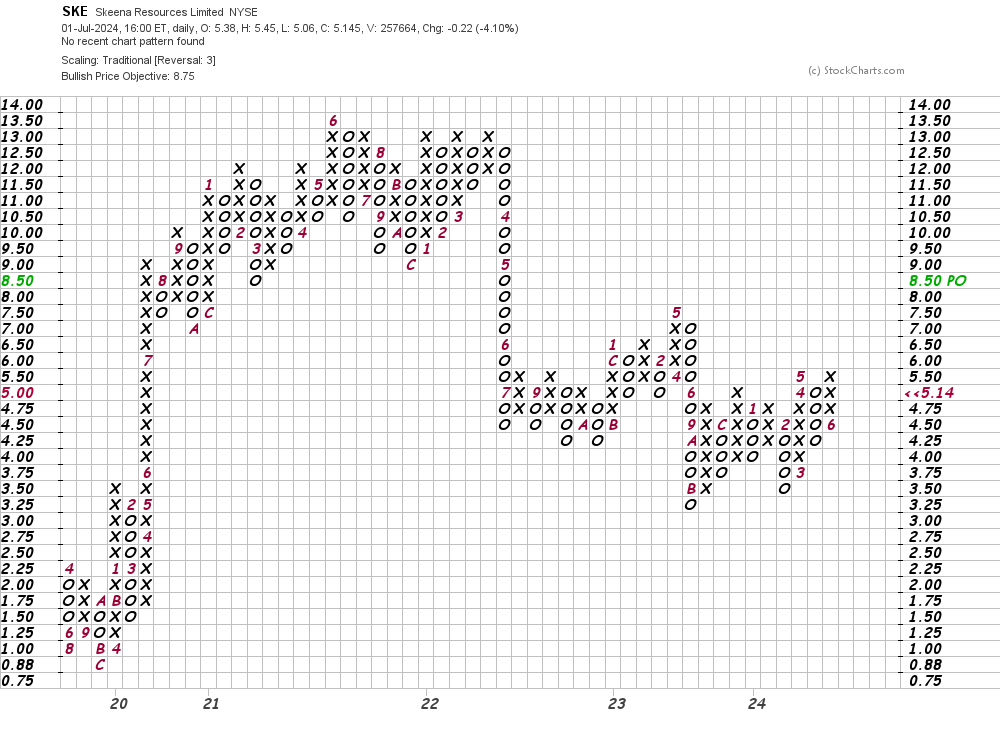
In this daily Point and Figure chart of SKE, below, I can see an upside price target in the $9 area.
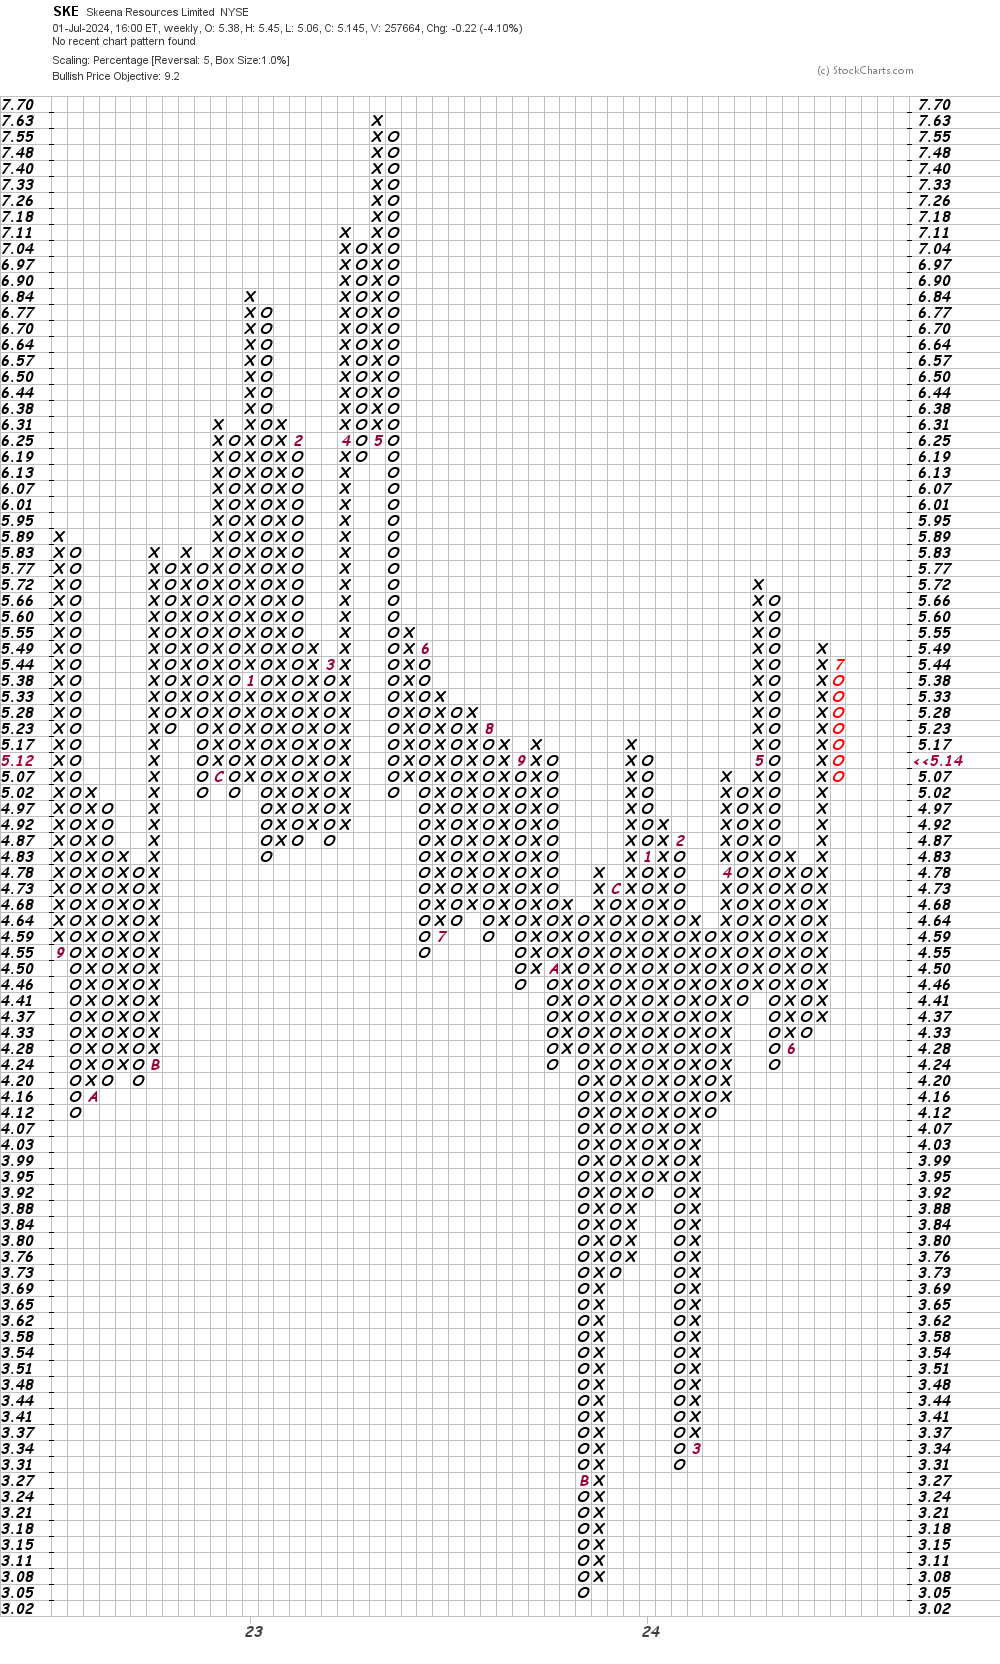
In this first weekly Point and Figure chart of SKE, below, I used a percentage move scaling with a five-box reversal filter. Here the software shows us a price target in the $9 area.
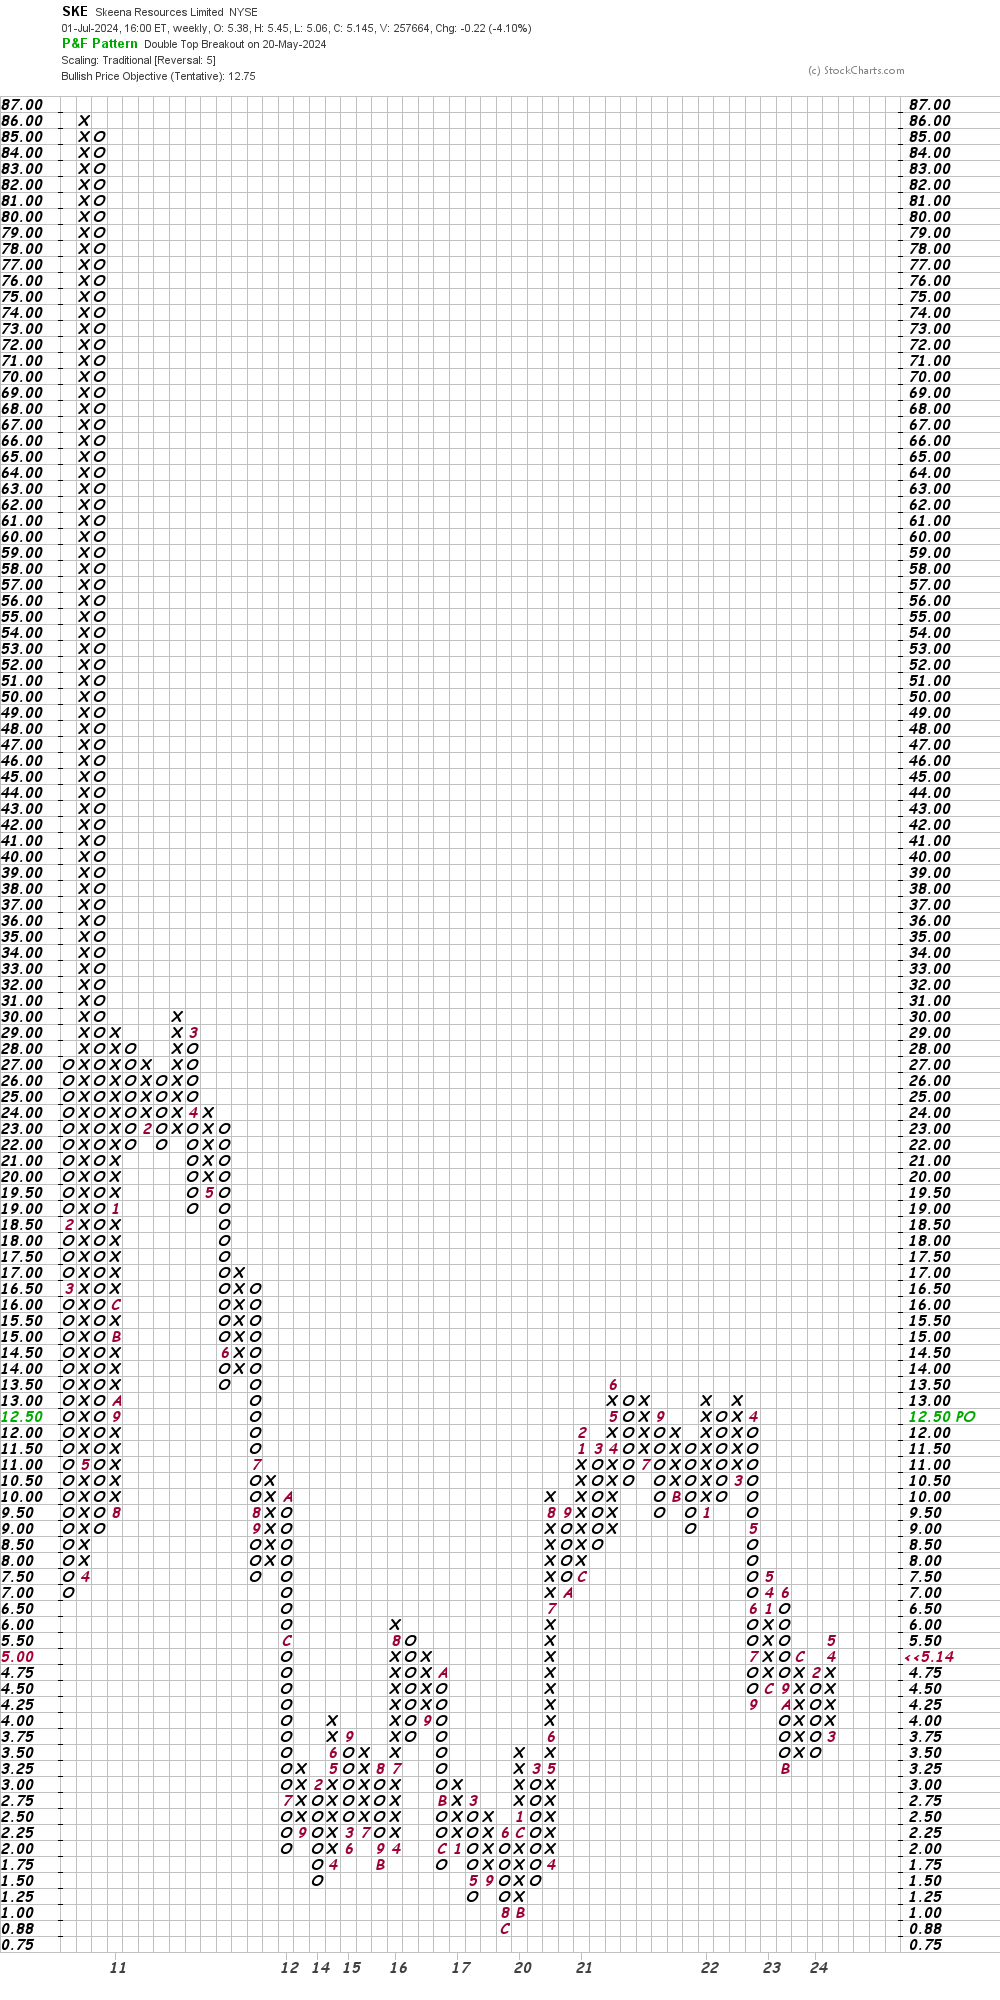
In this second weekly Point and Figure chart of SKE, below, I used a traditional scaling with a five-box reversal filter, which suggests a price target in the $13 area.
Bottom-line strategy: The charts of SKE, above, show promise of some significant gains but the base pattern needs more development before purchases are warranted.
Employees of TheStreet are prohibited from trading individual securities.