This Energy Stock Is Now One to 'Watch'
Will we see drill baby drill in 2025 and beyond?
You've reached your free article limit
You've read 0 of 1 free Pro articles.
Oll service company Baker Hughes BKR has been moving higher in recent months and now looks like a good time to see how the trends and indicators are doing.
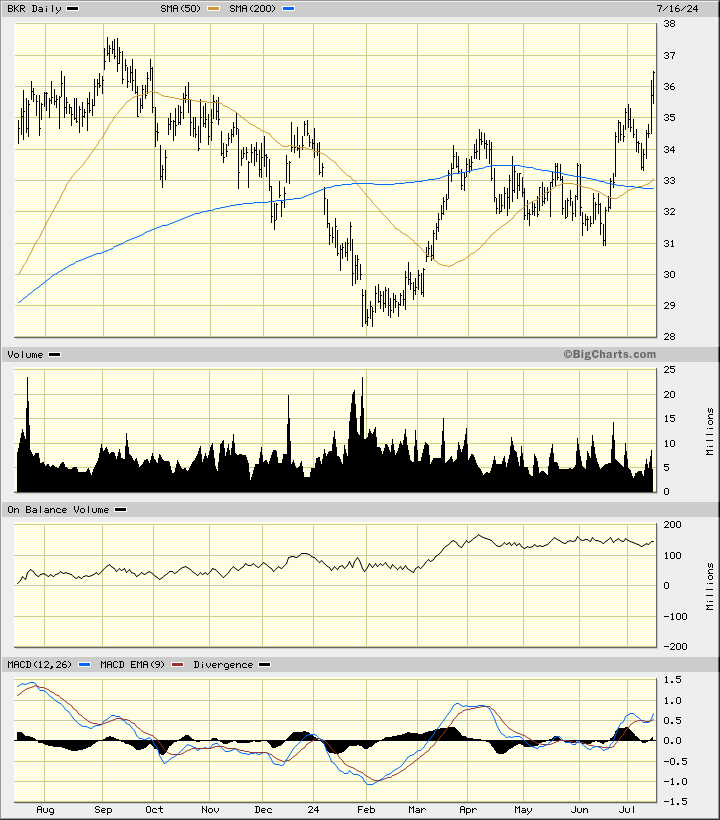
In the daily bar chart of BKR, below, I can see that the shares have rallied from a low in late January. BKR trades above the rising 50-day moving average line and above the bottoming 200-day moving average line.
The On-Balance-Volume (OBV) line has remained steady since early April and is close to making a new high for the move up to confirm the price gains. The Moving Average Convergence Divergence (MACD) oscillator is in a bullish alignment above the zero line.
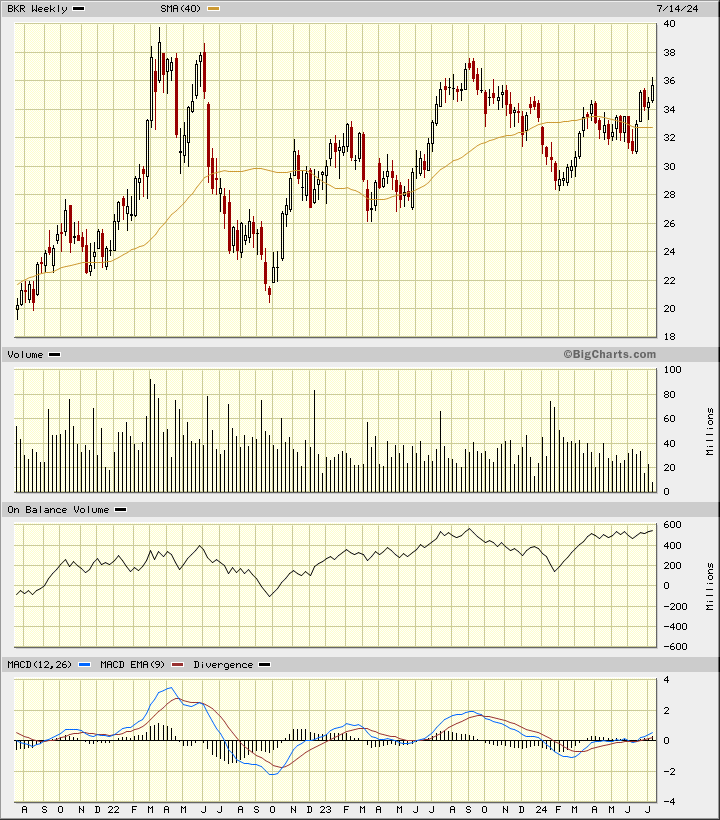
In the weekly Japanese candlestick chart of BKR, below, I can see a large or rather massive triangle formation. The shares have traded in a large pattern with higher lows and lower highs. Prices should stage an upside breakout soon. BKR trades above the bottoming 40-week moving average line.
The weekly OBV line has followed the price action and is generally bullish. The MACD oscillator is now back above the zero line.
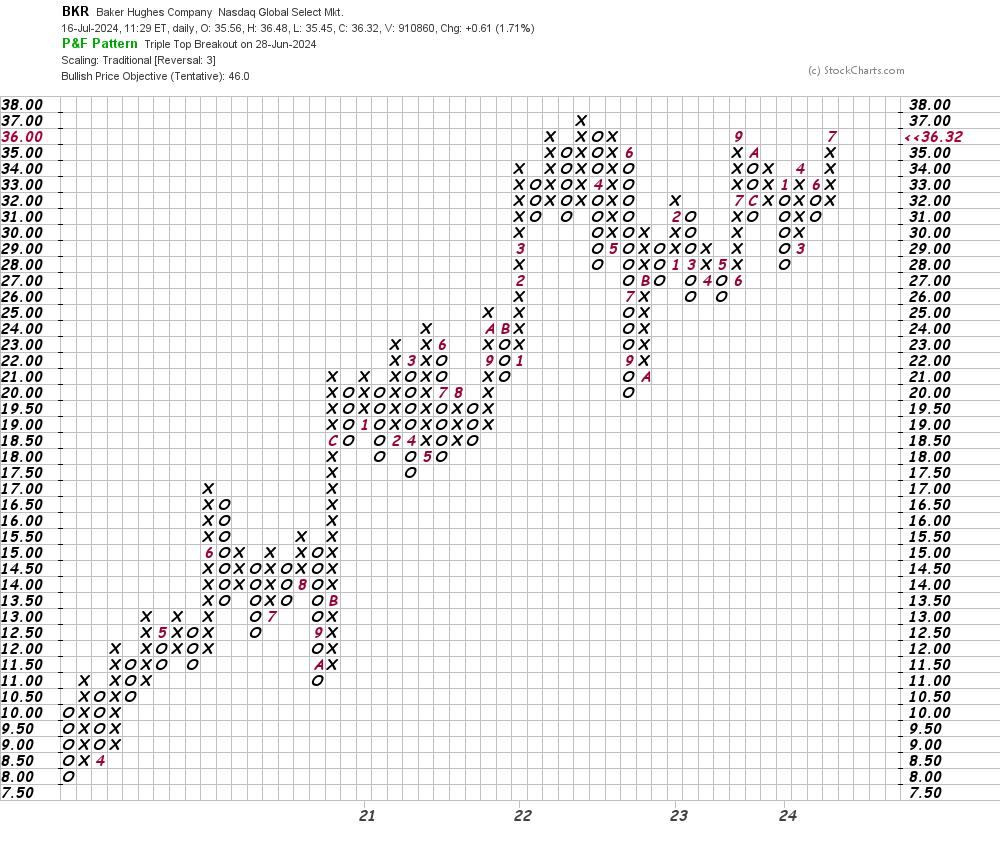
In this daily Point and Figure chart of BKR, below, I can see a price target in the $46 area.
In this weekly Point and Figure chart of BKR, below, I used a five-box reversal filter, which projects the $52 area.
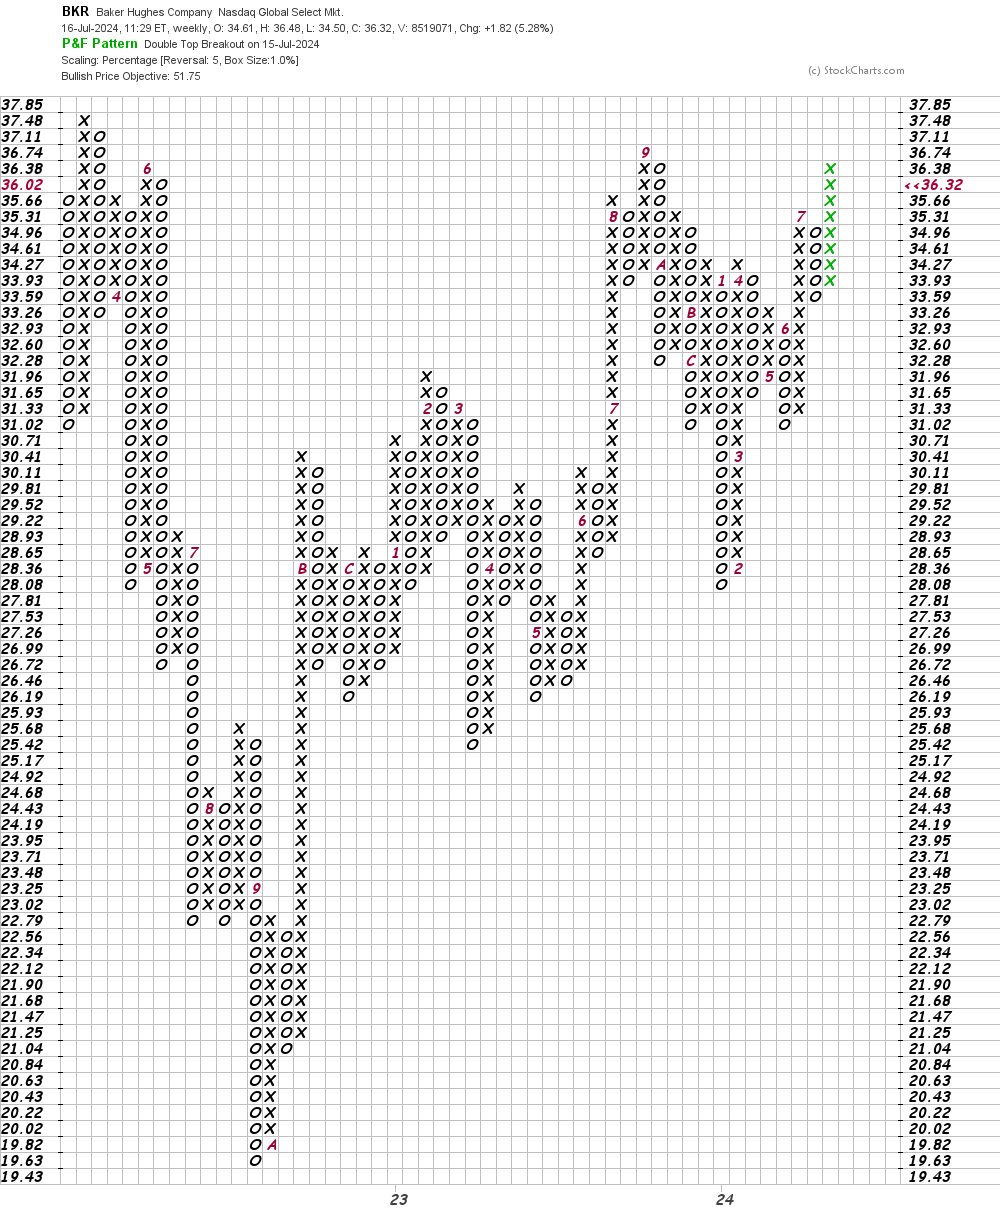
Bottom-line strategy: Traders could go long BKR at current levels and/or on strength above $37.50. My price targets are in the $46-$52 area. Risk to $30 for now.
I've added BKR to my Watch List.
Employees of TheStreet are prohibited from trading individual securities.