Will the Dollar Index Reveal a 'Golden' Opportunity?
Let's take a look at the buck's moves as the DXY continues to decline.
You've reached your free article limit
You've read 0 of 1 free Pro articles.
The U.S. Dollar Index (DXY) is closely watched for many reasons. I suspect that our enemies are watching the dollar even closer lately, as our position on the world's stage is challenged more and more. Let's check out two charts to see how things are moving lately.
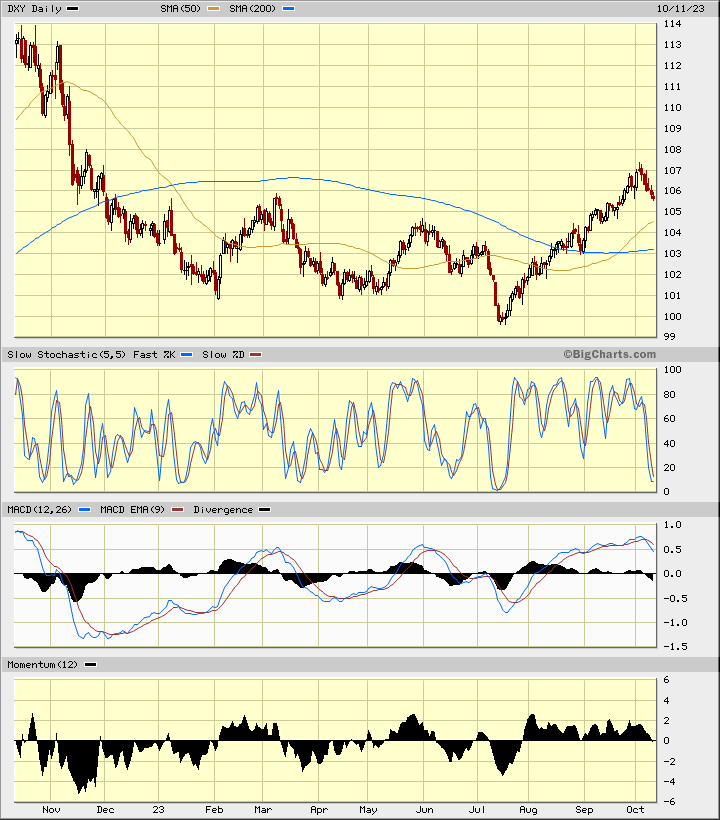
In this daily Japanese candlestick chart of the DXY, below, I can see that prices have weakened in October. The DXY still trades above the rising 50-day moving average line and above the rising 200-day line. The slow stochastic indicator has turned down sharply in October. The Moving Average Convergence Divergence (MACD) oscillator has crossed to the downside for a take profit sell signal. The 12-day price momentum study shows us a weakening pattern on price momentum from early August. This is a bearish divergence and could be foreshadowing a downside correction.
In this weekly Japanese candlestick chart of the DXY, below, I can see a top reversal pattern in recent weeks. A top reversal can mean a change in trend to sideways from up or from up to down. The weekly stochastic indicator has crossed to the downside and the MACD oscillator has started to narrow suggesting a weaker trend strength reading.

Bottom line strategy: A sustained decline in the value of the U.S. Dollar will likely give gold a boost.
Employees of TheStreet are prohibited from trading individual securities.