The 8-Year Cycle in Gold Is Making a Bottom
Right right now I see positive signs in the precious metals markets.
You've reached your free article limit
You've read 0 of 1 free Pro articles.
James E. Sinclair passed away on Friday, October 6 and he was one of the so-called original gold bugs back in the 1970s. Some gold bugs would say that the late James Dines was THE original gold bug with some of his forecasts but I will leave that debate to another day.
Today I want to suggest we are seeing the 8-year cycle in gold make a bottom.
Let's check out a couple of charts.
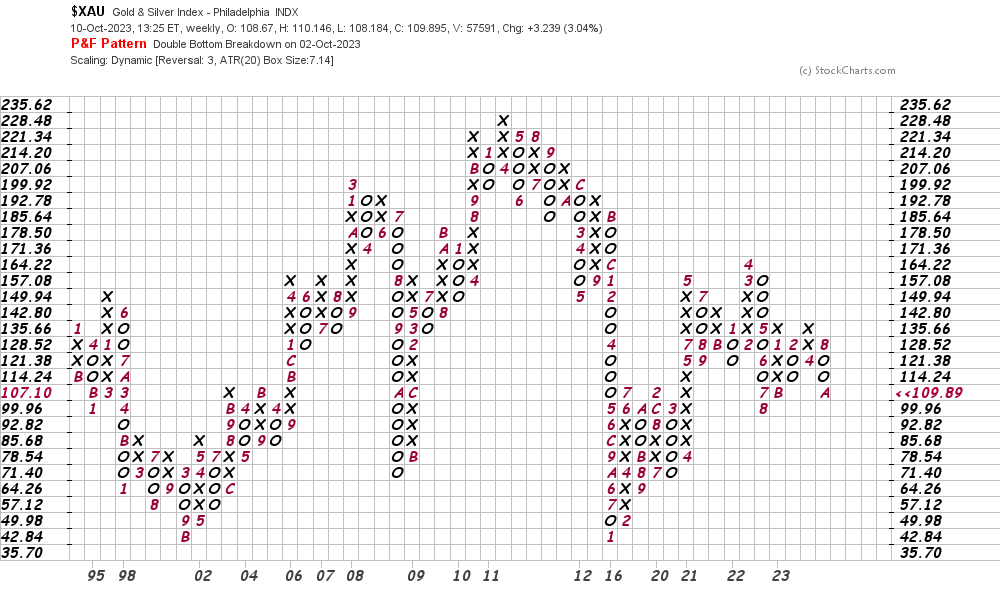
In this first chart of the ^XAU - the Philadelphia Gold & Silver Index, I used this index because it had enough price data to show you what I want to point out. In this monthly line or close only chart of the XAU, below, I can see the price history back to 1985. Notice the price lows in 1992, 2000, 2008, 2016 and perhaps now instead of 2024.
In this weekly Point and Figure chart of the XAU, below, I can see the lows in 2000, 2008 and 2016. A rally to $135.66 should confirm the idea that we are seeing the eight year cycle low in the XAU.
In this monthly line chart of the popular gold ETF - GLD , below, I can see that the Moving Average Convergence Divergence (MACD) oscillator is potentially in a position to soon give us a fresh outright buy signal.
Bottom line strategy: Gold bugs are like broken records but right now I see positive signs in the precious metals markets. Market observers say that gold suffers from rising real and nominal interest rates.
However, the most bullish factor for gold is that the faith in governments is waning around the world and that will push more central banks, institutions and people to accumulate gold in the coming years.
Employees of TheStreet are prohibited from trading individual securities.