Spotify's Price Gains Look Like a 'Gift Horse'
Let's check out the charts and indicators.
You've reached your free article limit
You've read 0 of 1 free Pro articles.
Shares of the digital music streaming service Spotify SPOT have surged about 15% in value Tuesday after the company reported their Q1 results to shareholders earlier today.
Let's check out the charts and indicators.
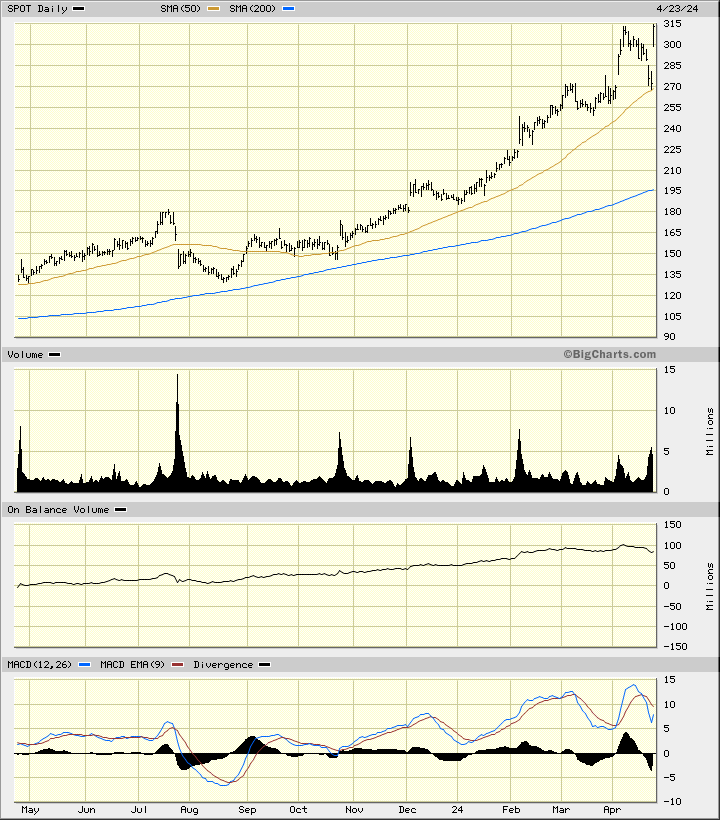
In this daily bar chart of SPOT, below, I see a mixed picture. Prices are in an uptrend for sure but also extended (overbought) when compared to the 200-day moving average line.
The trading volume looks like it has been more active in the past three months but the On-Balance-Volume (OBV) line has been "rolling over" during that same period. The Moving Average Convergence Divergence (MACD) oscillator has struggled the past two months.
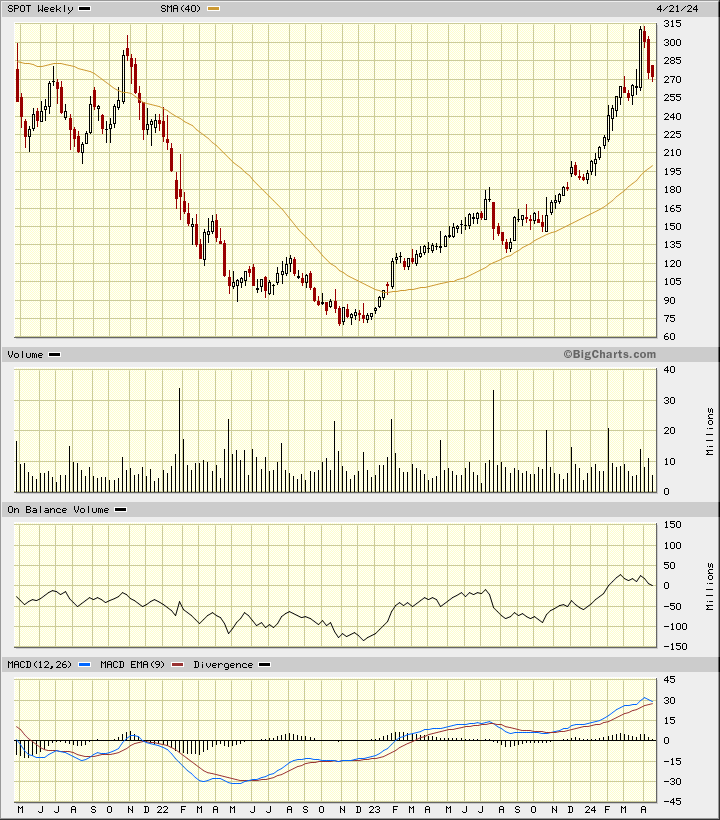
In this weekly Japanese candlestick chart of SPOT, below, I can see a huge rally from the nadir in 2022. Prices are up more than four-fold so some early buyers may be looking to nail down profits. The slope of the 40-week moving average line is positive.
The weekly OBV line has been stalled the past two months. The MACD oscillator is above the zero line but has narrowed in recent weeks.
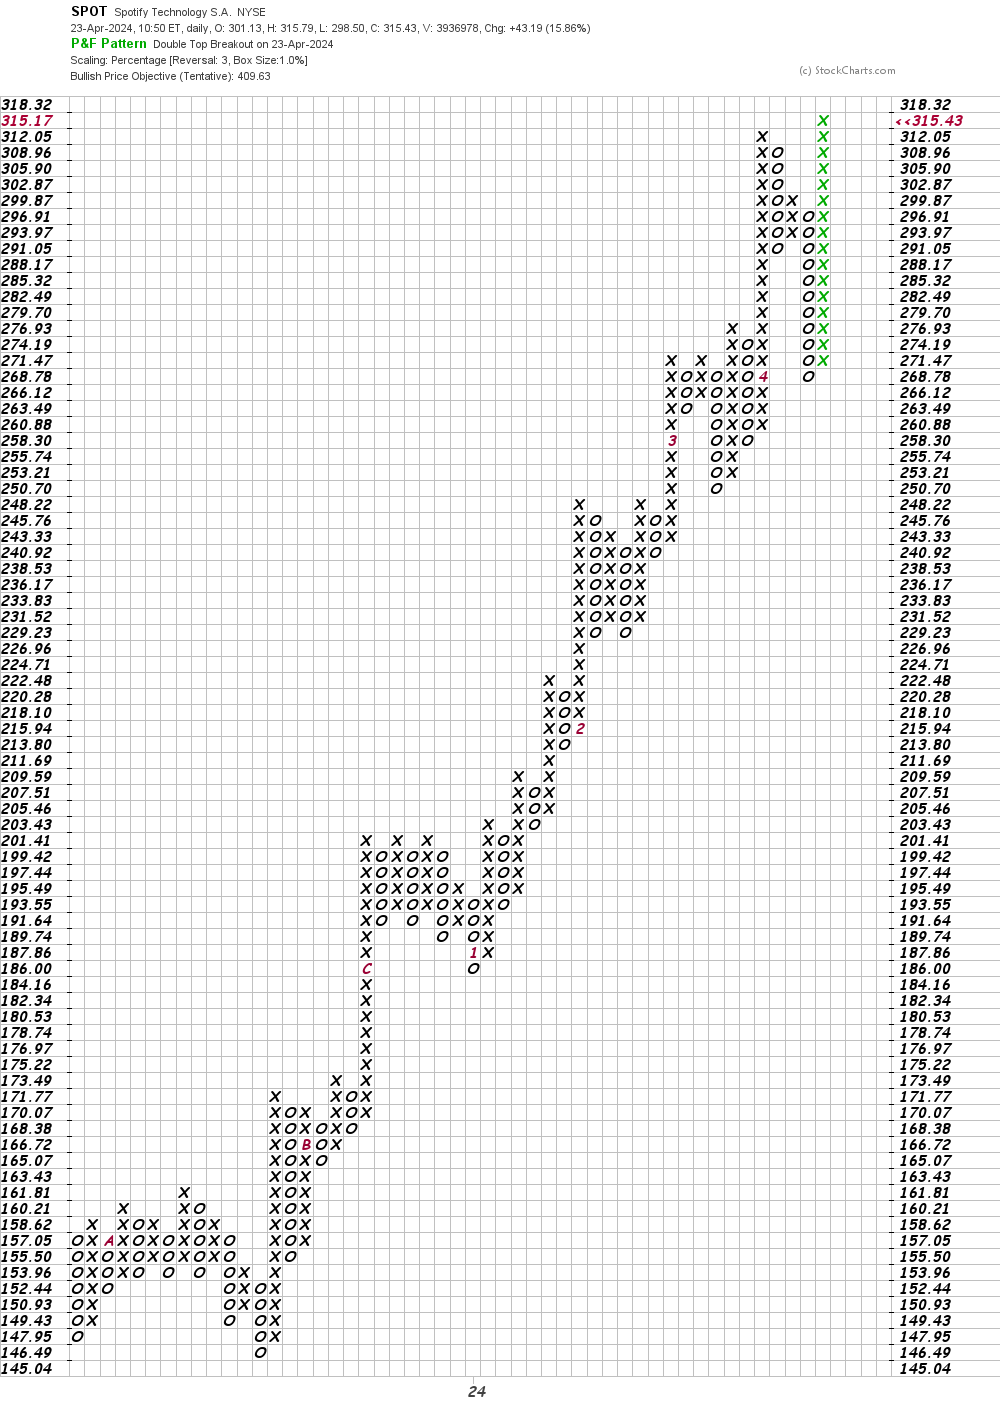
In this daily Point and Figure chart of SPOT, below, prices have made a new high for the move up to refresh the uptrend. A price target in the $410 area is being projected.
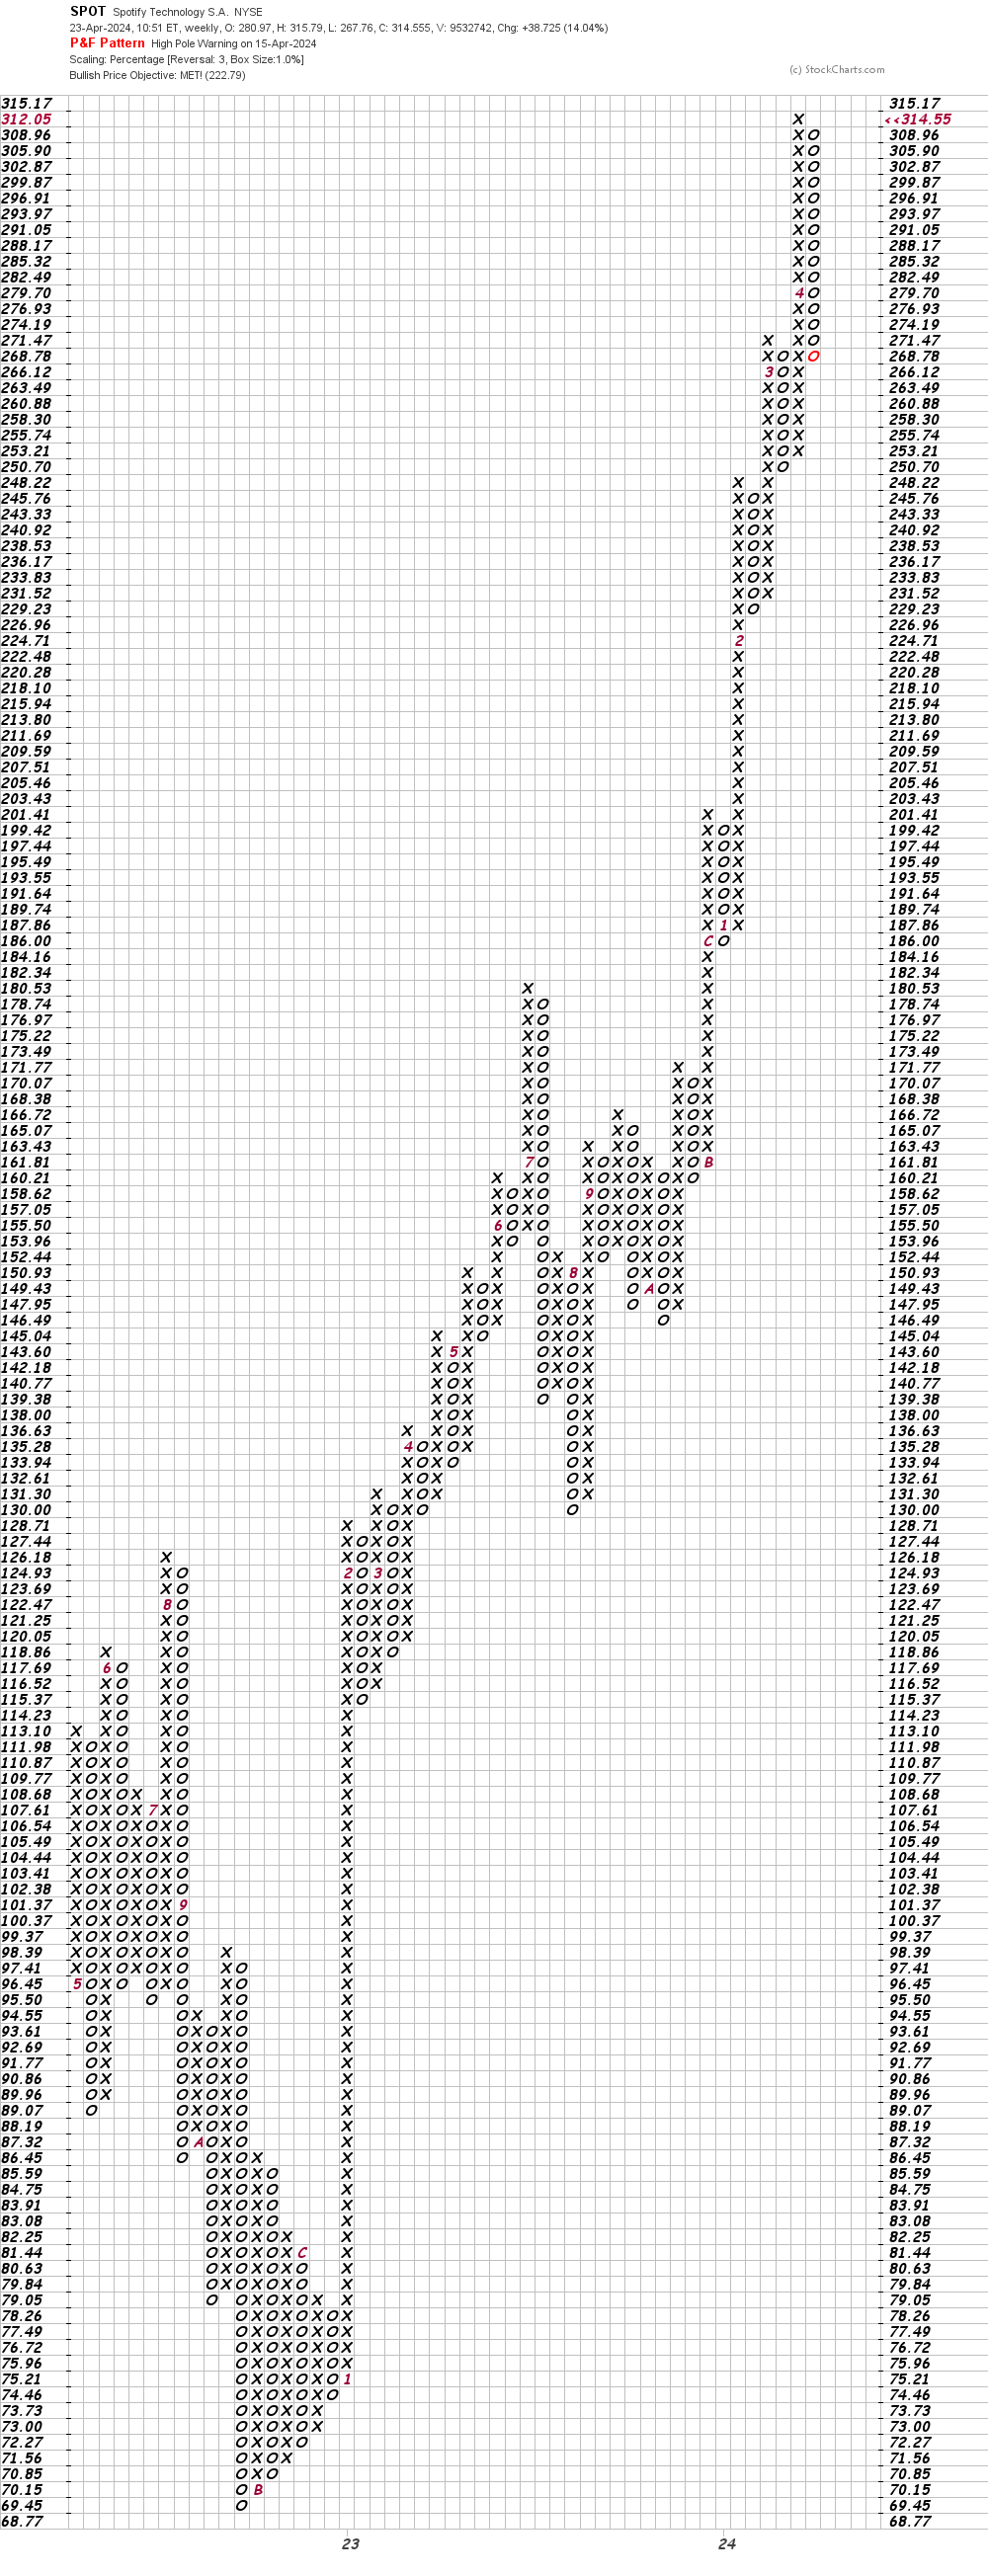
In this weekly Point and Figure chart of SPOT, below, I can see that prices reached and exceeded an upside price target in the $223 area.
Bottom line strategy: In my review of the charts of SPOT on March 26, I recommended that "Traders should take profits and look for fresh opportunities elsewhere". Today's price gains look like another "gift horse".
Employees of TheStreet are prohibited from trading individual securities.