Snowflake Gets Spillover Selling From AT&T Hack
Here's what we expect from SNOW shares going forward.
You've reached your free article limit
You've read 0 of 1 free Pro articles.
Data storage, processing, and analytic solutions firm Snowflake SNOW is selling off Friday on the heels of the reported AT&T T data breach. SNOW has seen its shares decline alongside T Friday morning reflecting investor concern over implications of the incident.
Let's check out SNOW.
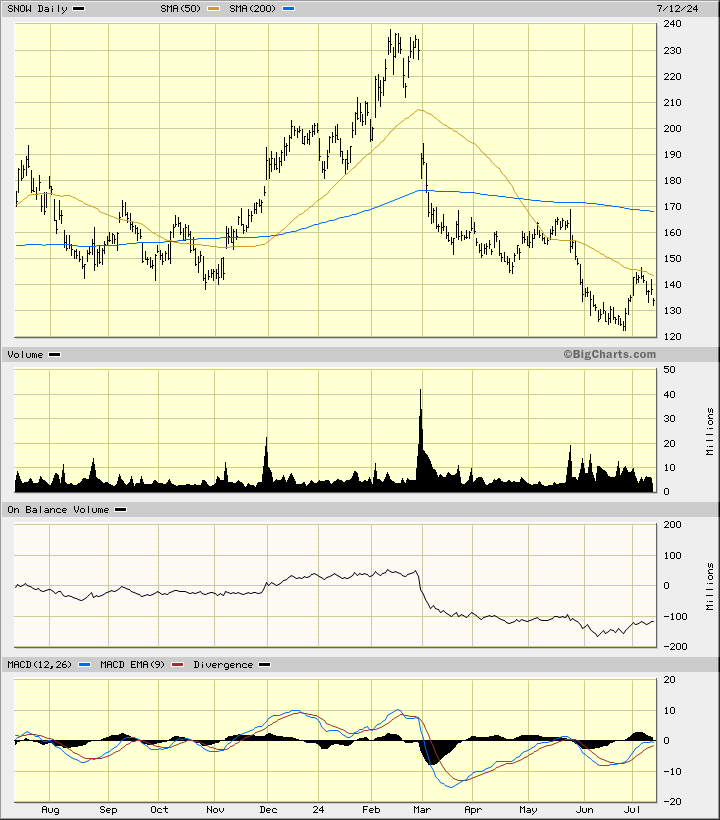
In the daily bar chart of SNOW, below, I can see that the shares have been in a "tailspin" since February. Prices trade below negatively sloped 50-day moving average line and the negatively sloped 200-day moving average line.
Trading volume has increased the past seven or eight weeks and suggests we are seeing some traders vote with their feet. The On-Balance-Volume (OBV) line has been weak since late February but shows a slight uptick in recent days. The Moving Average Convergence Divergence (MACD) oscillator is below the zero line.
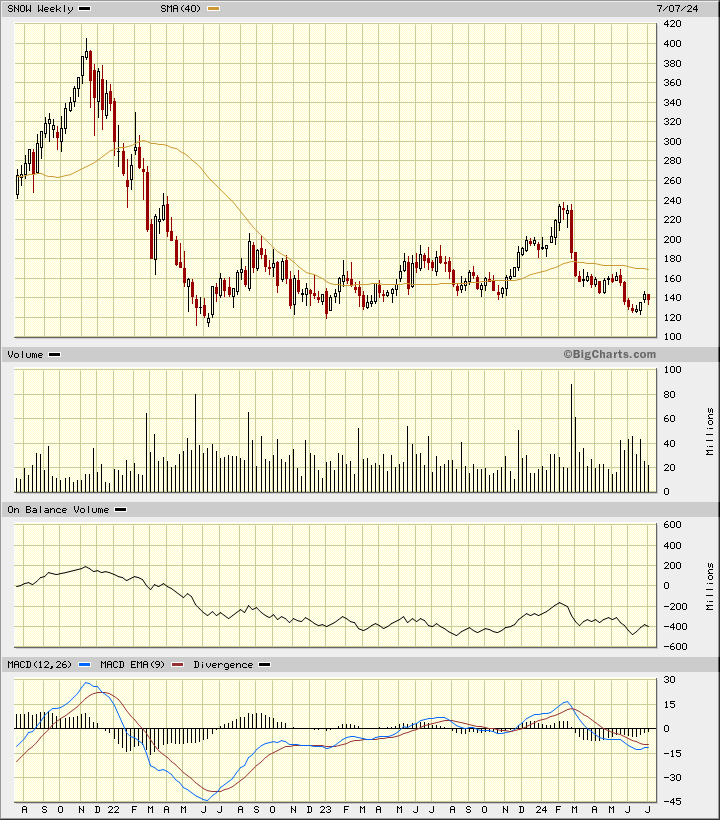
In the weekly Japanese candlestick chart of SNOW, below, I can see that prices have been struggling since February. SNOW trades below the declining 40-week moving average line.
The weekly OBV line is in a weakening trend. The MACD oscillator is below the zero line.
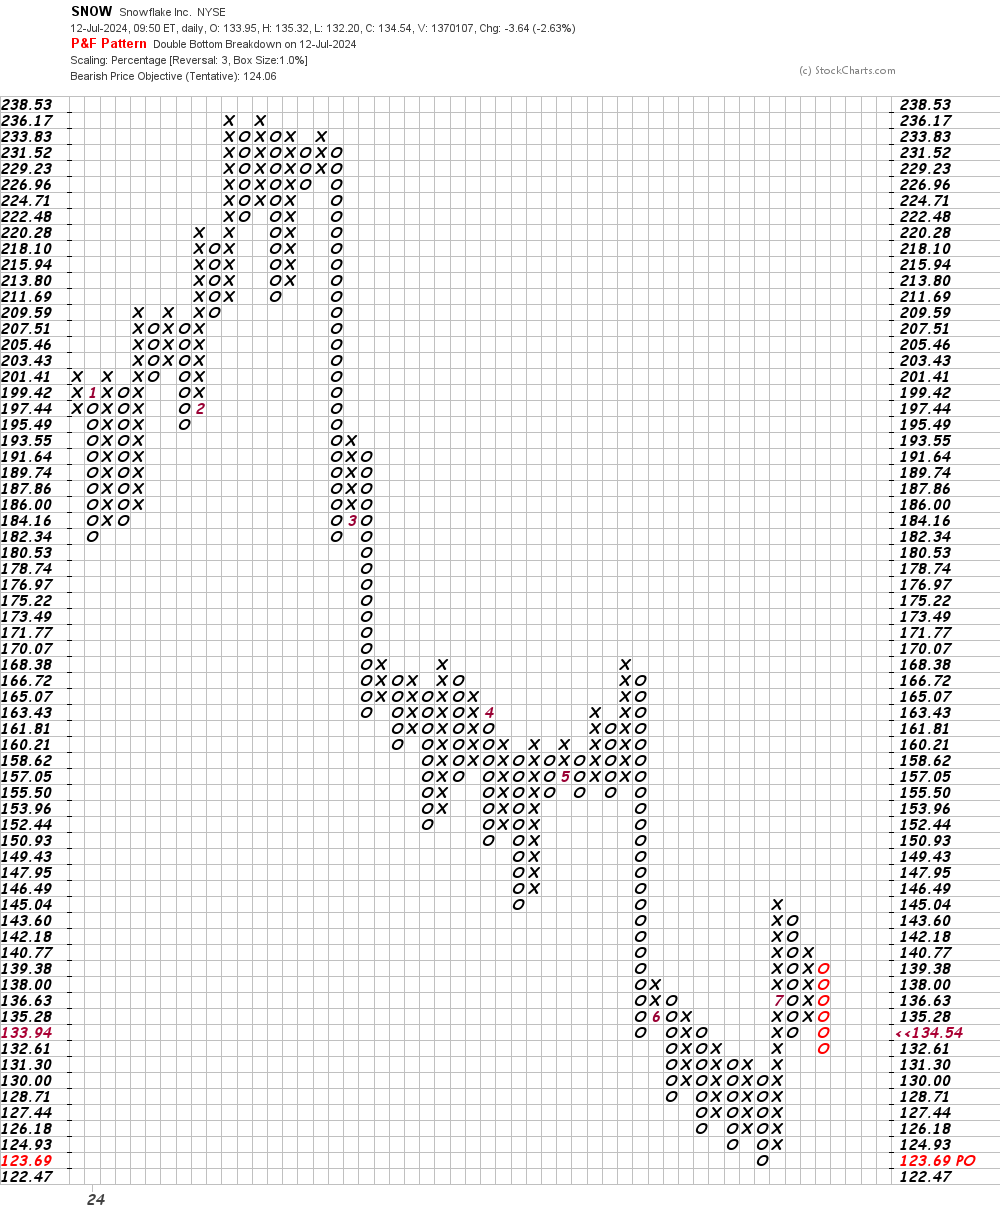
In this daily Point and Figure chart of SNOW, below, I can see a price target in the $124 area.
In this weekly Point and Figure chart of SNOW, below, I can see a price target in the $81 area.
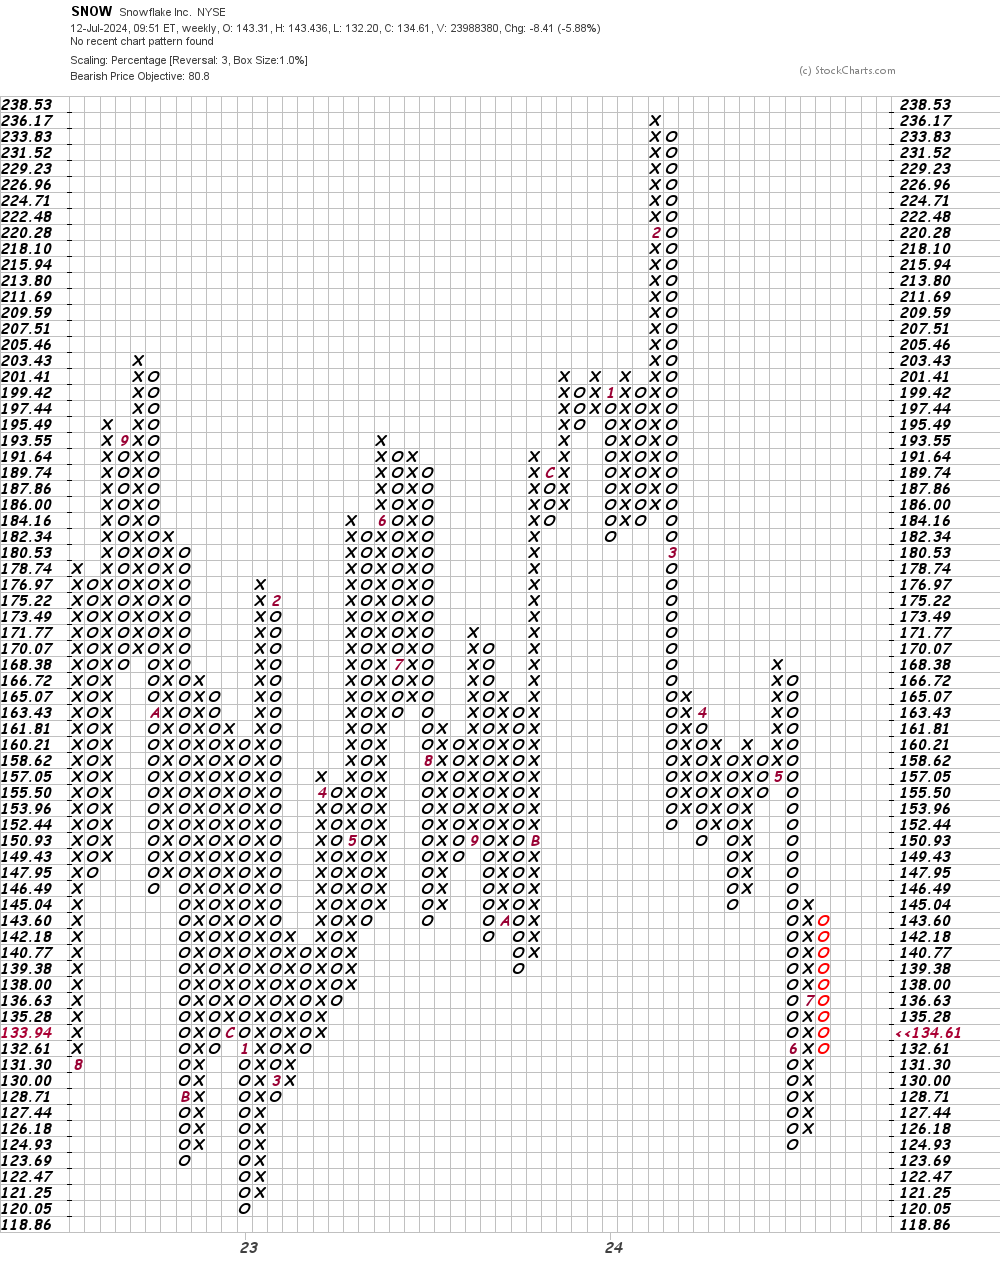
Bottom-line strategy: The charts and indicators of SNOW suggest we could see further declines in the weeks ahead.
Employees of TheStreet are prohibited from trading individual securities.