Investors Should Avoid This Cloud Software Company
After a steady first half of May, shares of a cloud software firm have continued to weaken and traders avoid the long side.
You've reached your free article limit
You've read 0 of 1 free Pro articles.
In my May 2, 2024 RMP review of shares of cloud software company Snowflake SNOW, I wrote that "Shares of SNOW have made an important decline in the past two months and the indicators have yet to improve. SNOW could rally in the weeks ahead but I think it will need more basing (read: sideways) price action before the conditions are right for a rally."
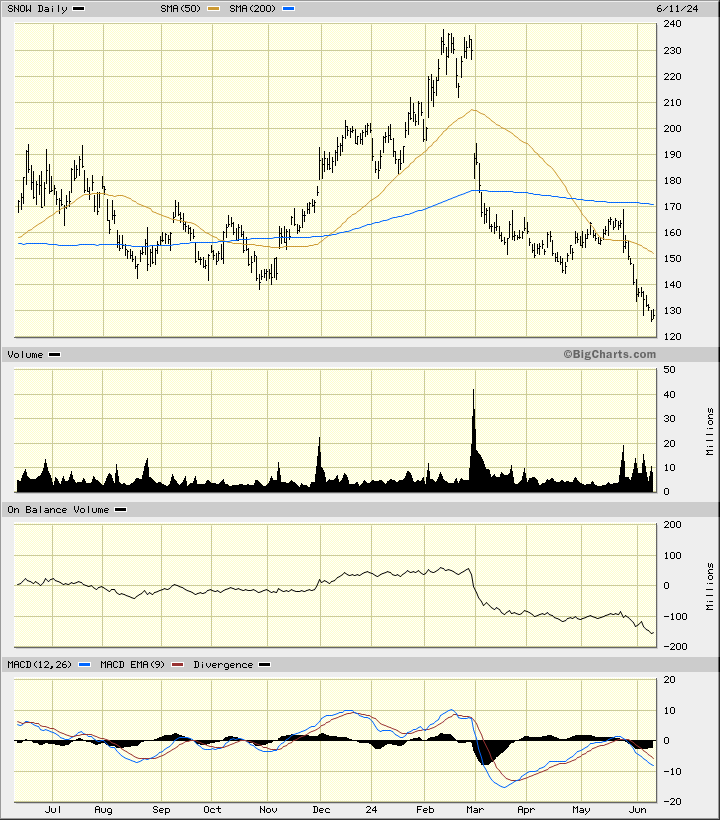
Shares of SNOW have continued to weaken after a steady first half of May. Prices failed at the underside of the 200-day moving average line and are now trading below the negatively sloped 50-day and 200-day lines. The daily On-Balance-Volume (OBV) line remains weak and in a downward trend since late February. The Moving Average Convergence Divergence (MACD) oscillator is in a bearish alignment below the zero line.
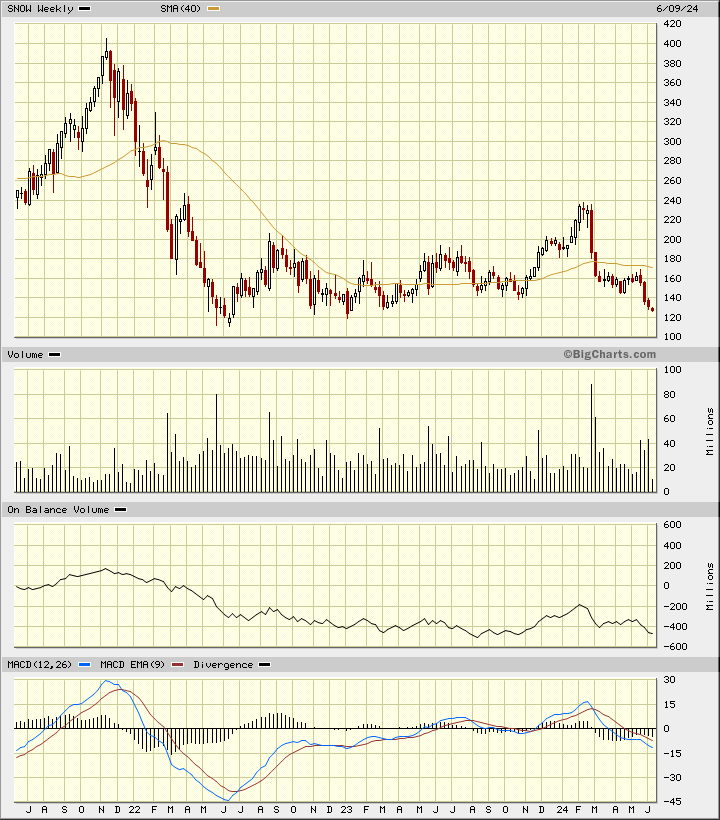
In this weekly Japanese candlestick chart of SNOW below, I see a bearish picture. Prices are trading below the negative sloped 40-week moving average line. The candles do not yet show us a reversal pattern and no lower shadows to suggest that traders are rejecting the lows. Reading the chart from right to left we can see that any potential chart support is old and not reliable. The weekly OBV line is close to making a new low for the move down. The MACD oscillator is in a bearish alignment below the zero line.
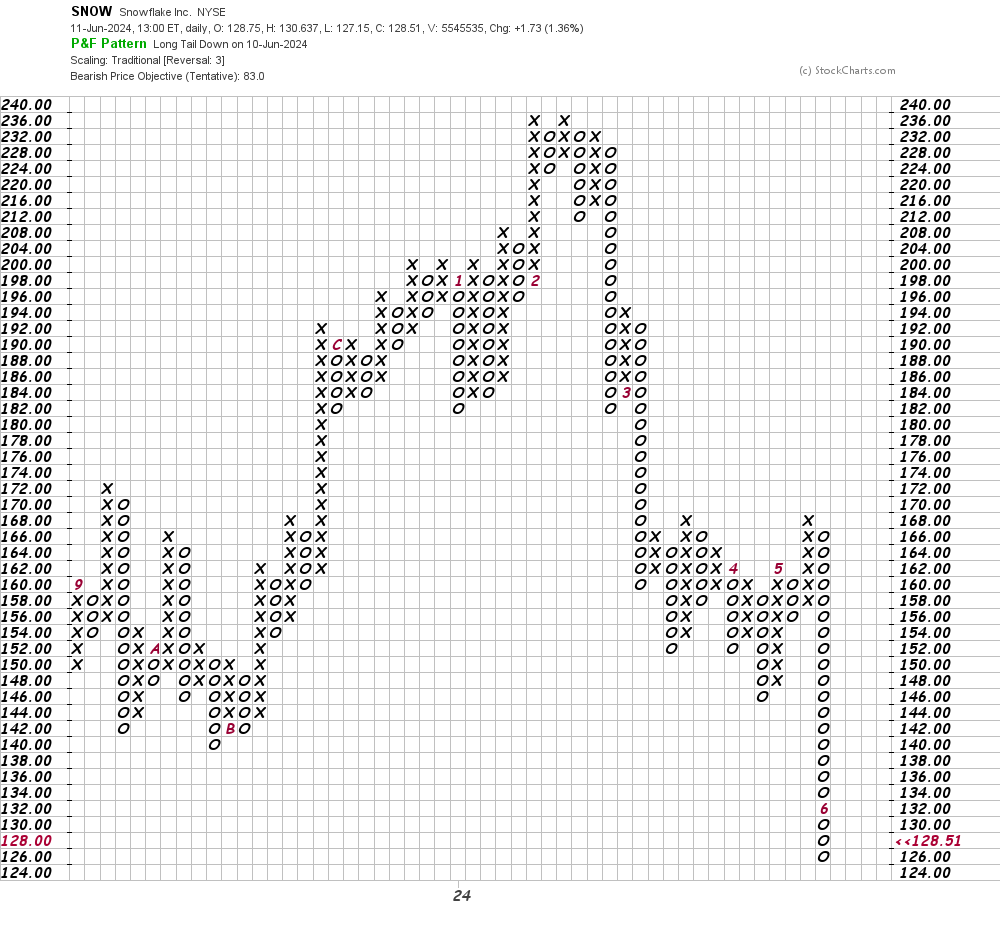
In this daily Point and Figure chart of SNOW below, I can see that the software is projecting a potential downside price target in the $83 area.
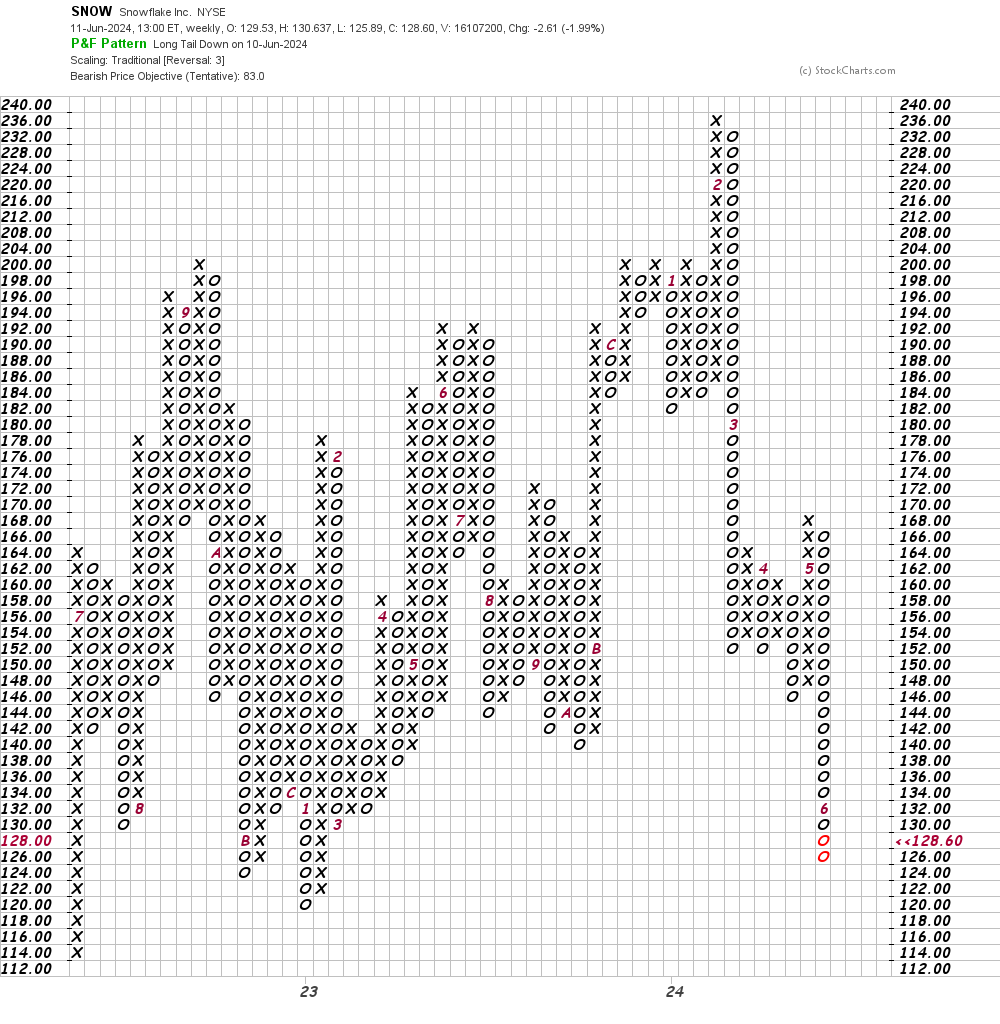
In this weekly Point and Figure chart of SNOW below, I can see the same price target of $83 as shown in the daily chart above.
Bottom line strategy: It looks like the shares of SNOW will suffer in the summer months ahead. Avoid the long side of SNOW as further declines look possible.
Employees of TheStreet are prohibited from trading individual securities.