A Simple Plan for Trading Two Popular ETFs
These charts scream simplicity, so use the K.I.S.S. strategy for success.
You've reached your free article limit
You've read 0 of 1 free Pro articles.
One of the first lessons I learned trading was K.I.S.S.
Keep it simple, stupid.
While the phrase may have been emulated by the U.S. military, it holds true to any activity requiring discipline. Don’t overcomplicate tasks. Don’t overthink what is right in front of you.
There is beauty in simplicity.
Simplicity, especially in trading, does not mean you won’t make mistakes or have losses. You will, but if your system is complex, you may be unable to identify what went wrong. With a simple trading system, you should easily be able to identify where and why something went wrong. Knowing where a trade went wrong helps you avoid repeating the same mistake in the future.
Your goal should be simplicity.
When you see a technical analysis chart with five or six indicators on it, run away. It may work for the person using it (probably not), but it won’t be easy to learn and will not work for the masses.
That brings us to a weekly chart on the SPDR S&P 500 ETF SPY and the VanEck Vectors Semiconductors ETF SMH. These charts scream simplicity. They are virtually identical, at least from the way their price is moving.
I’m not arguing they are interchangeable from an investment standpoint. After all, one is up 14.4% this year while the other has skyrocketed higher by nearly 50%, but when you examine the two charts below, you’ll understand what I mean.
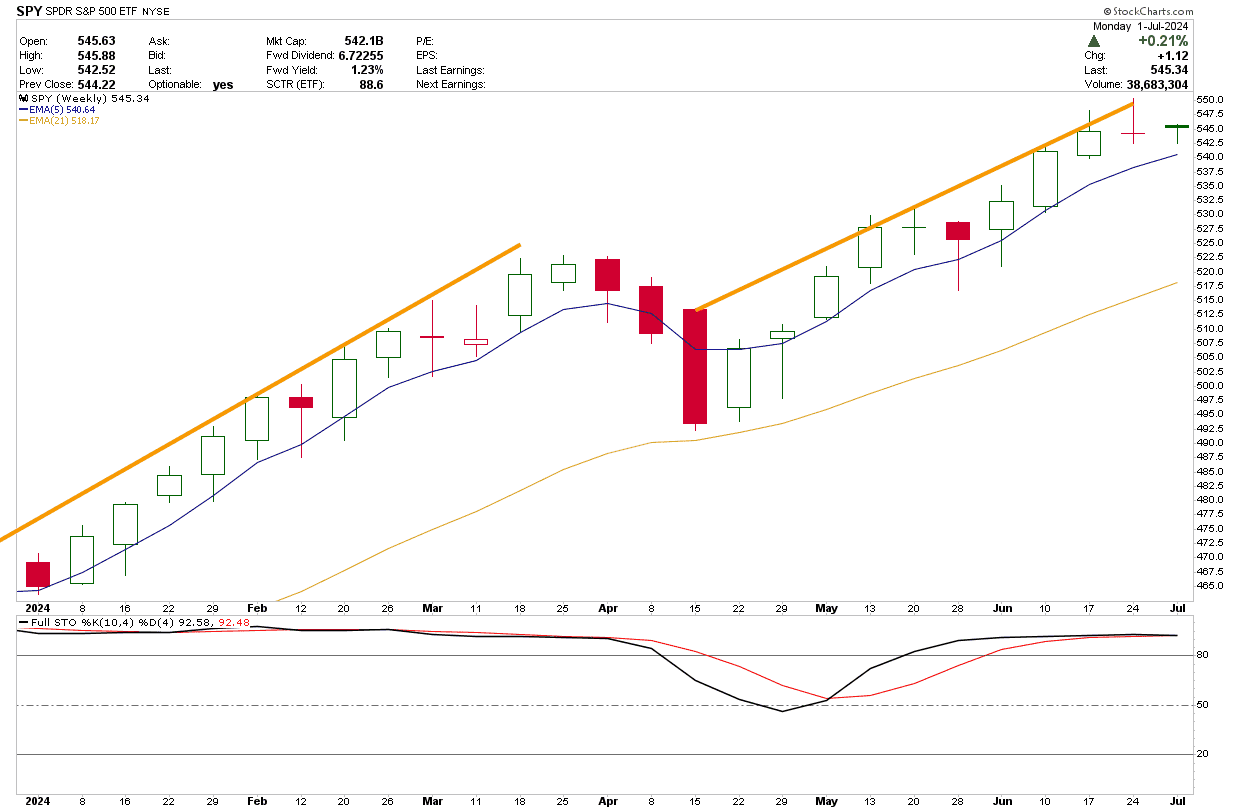
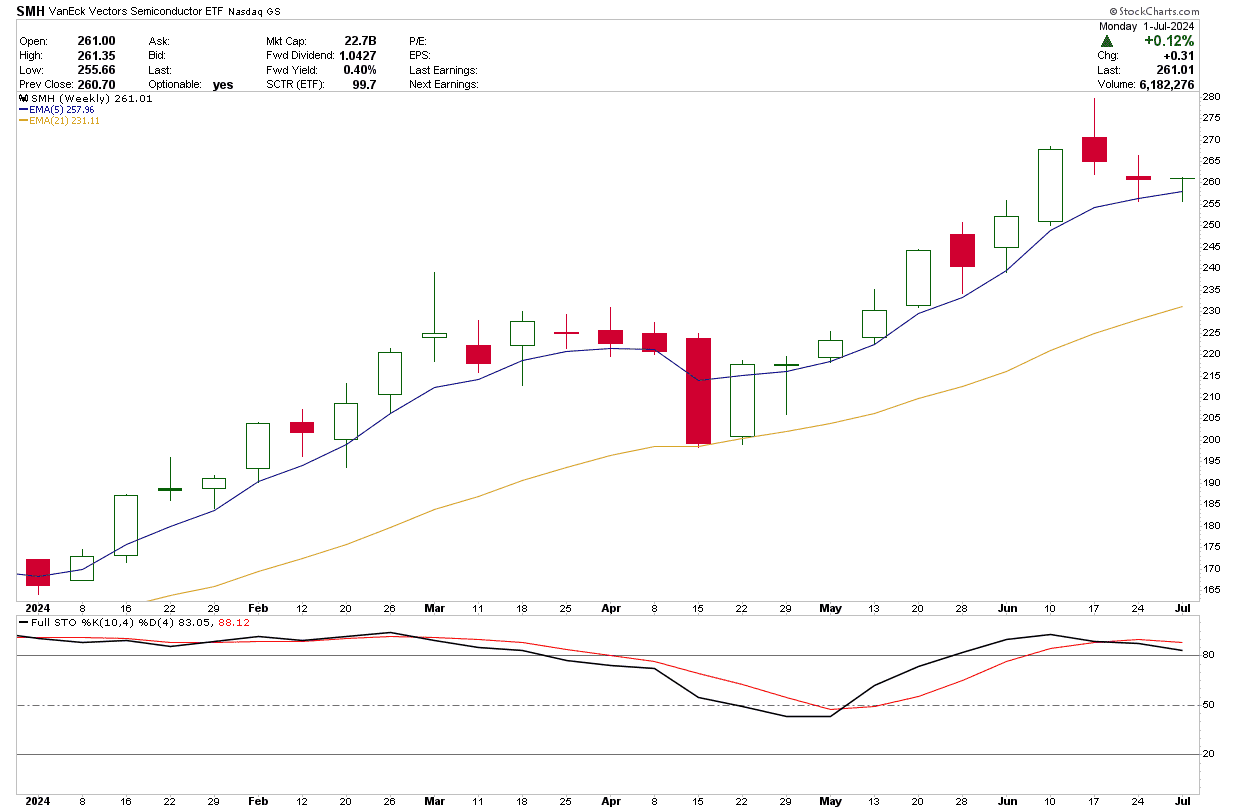
Although the overall performance has been quite different, the pattern that the SPY and SMH followed appears quite similar. Both ETFs have bounced off their 5-week exponential moving average (EMA) virtually the entire move higher. In fact, their weekly lows have seldom strayed far from the 5-week EMA.
When the 5-week EMA failed, both ETFs found support around their 21-week exponential moving average.
That brings us to the K.I.S.S. thesis. Buy near the 5-week EMA. Sell if it fails to hold. Look to buy at the 21-week EMA when the 5-week EMA fails. Take profits along the way.
One last note on SMH. The ETF has lost some momentum and appears at risk of closing below its 5-week EMA. The current setup resembles mid-March, a few weeks before the sharp April selloff. Just something to keep in mind if you have a position or are contemplating buying one.
At the time of publication, Byrne had no positions in any securities mentioned.