Riding the Cycles Into Early August
Let's take a look at the intermediate-term indicators to forecast the road ahead. We'll also look at MRNA, XBI, BMY, CAG, RTX, CHRW, and GOOGL.
You've reached your free article limit
You've read 0 of 1 free Pro articles.
The Market
For a few weeks now, I have been highlighting the end of July/early August as the period of time my intermediate-term indicators ought to get overbought. They are still on track for that.
For example, the Volume Indicator finally—finally!!!—ticked up last week and now resides at 53%. I believe it will get to the mid-50s sometime this week. Once it gets to the mid-50s it gets into overbought territory. The chart is shown here on Wednesday evenings.
But what about the fact that we are short-term oversold now? That goes hand in hand. A typical cycle would be a rally off a short and intermediate-term oversold condition –that’s what we got in early July. Then we should get short-term overbought as we did about two weeks ago. That ought to lead to a pullback/consolidation which then gets us back to short term oversold.
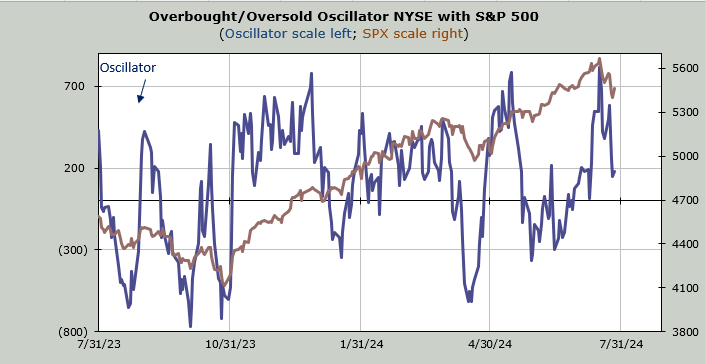
That should then lead to another short term oversold rally. Thus taking us into the intermediate term (and short term) overbought condition that is coupled with too bullish sentiment. For now that is what we are on track for.
Will the FOMC Meeting this week derail that? It might. I would never presume to know what the Fed will do or won’t do. But even more so, if I knew what they would do I’m not sure I could tell you the market’s reaction.
What could derail that view is the fact that the S&P has corrected so much already. Two weeks ago I showed you this chart with the upper line in place and the measured target of 5650. What I did not count on was that it would come to the lower line in a mere two weeks.
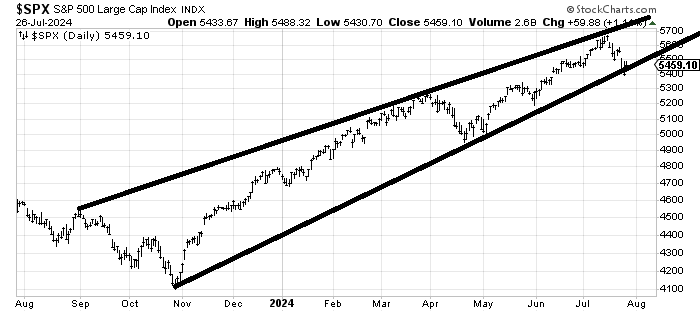
As you know, the QQQs have the same chart, I would love it if that lower line was broken some time in August because I think that would reset sentiment in a big way, not just a minor fashion.
You see the last few days have brought out the put buyers like we haven’t seen in more than two months. The ten day moving average of the put/call ratio has really ticked up from near .82 to .90 in a matter of days---heck Friday saw the put/call ratio at 1.04 and the market was solidly green!
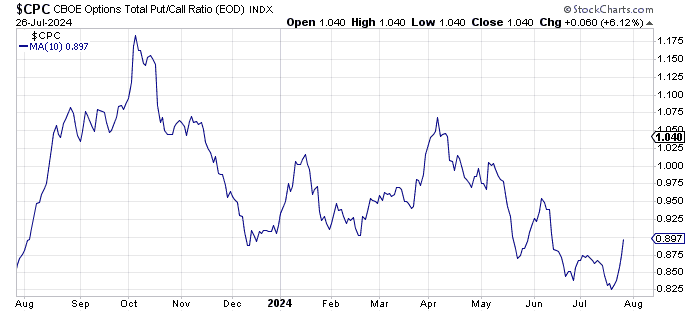
So I do look for some more upside this week as we make our way to the intermediate term overbought condition..
New Ideas
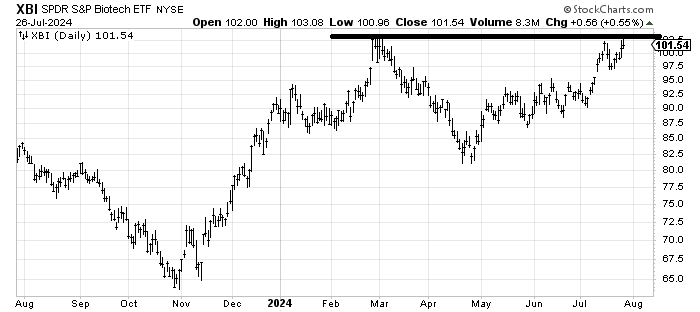
I have been bullish on XBI for a while but this is a reminder that the first target is in this 105-110 area so if it gets up there I’d take a few profits. Longer term there is a measured target in the 120 area.
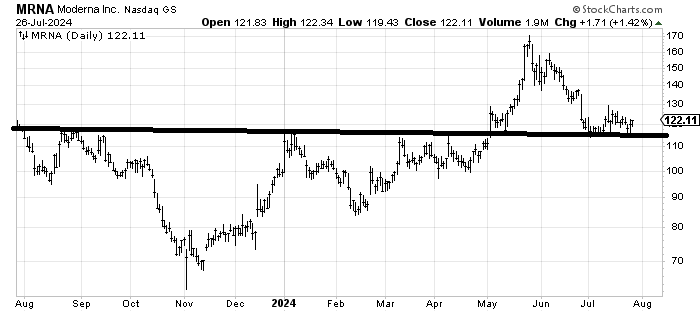
I am still waiting (not so patiently!) for Moderna MRNA to get going.
Today’s Indicator
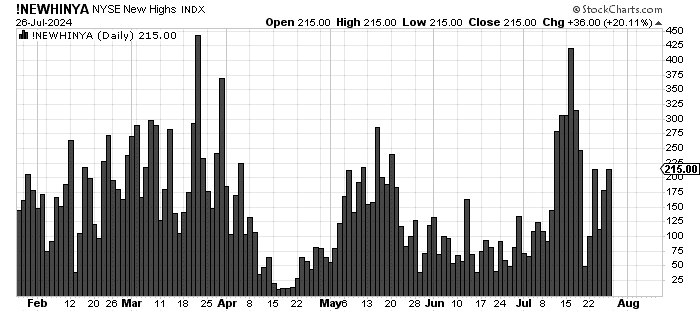
The number of stocks making new highs has not exceeded the recent readings yet. This week is a big test for that.
Q&A/Reader’s Feedback
Helene welcomes your questions about Top Stocks and her charting strategy and techniques. Please send an email directly to Helene with your questions. However, please remember that TheStreet.com Top Stocks is not intended to provide personalized investment advice. Email Helene here.
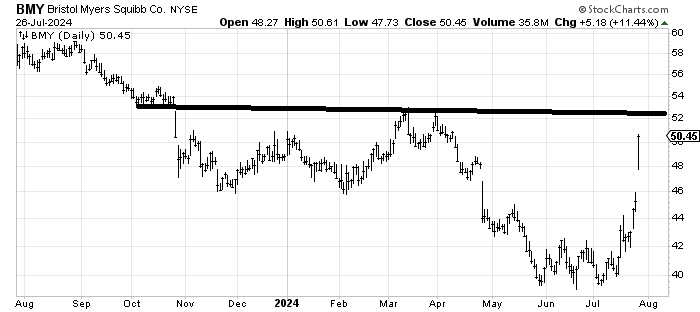
Bristol-Myers BMY gapped right up through the lower end of resistance and is trying to chew its way through. My rule of thumb is that when you get a pop of 10% (or more in this case) you take a little off the table. I think 52 is going to be quite tough to get through the first time up here.
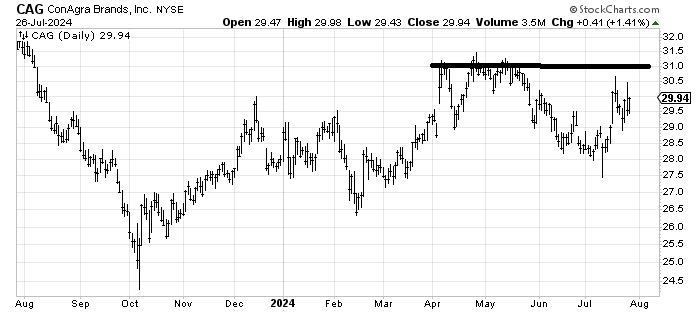
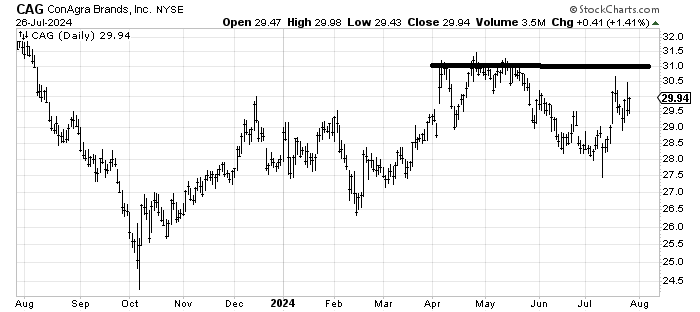
ConAgra CAG is an interesting chart. It really ought to try to get to 31 but those two spike tries in the last two weeks haven’t done so. Through 31 and the target would be mid 30s.
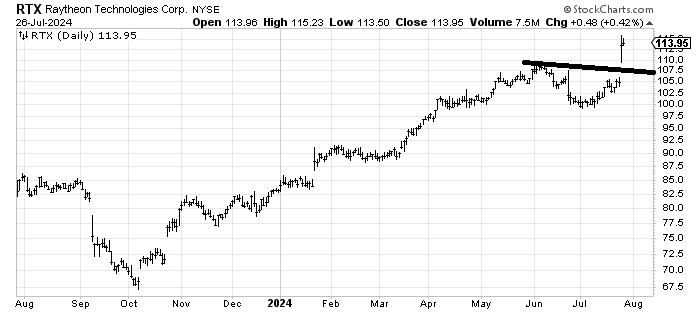
Raytheon RTX has a measured target in the 115-118 area so I would take some off the table and then you can use a trailing stop on the remainder. As a reminder I am a terrible chaser.
I am disappointed that CH Robinson CHRW did not rally last week but as long as it stays over 87-ish it gets the chance to do so.
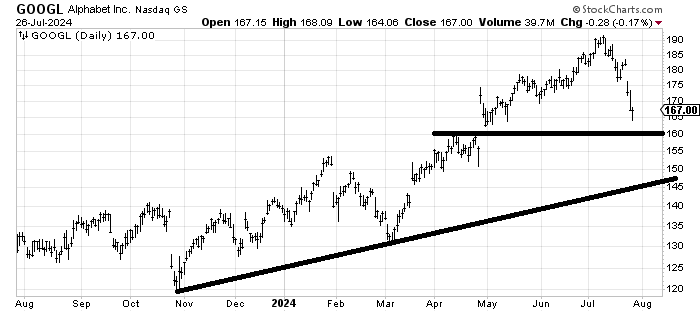
Alphabet GOOGL is a little bit oversold down here. If it can get smacked to that 160 gap fill in the next few days I would be a buyer for a trade.